
Figures & data
Figure 1. The inflatable vest construction.
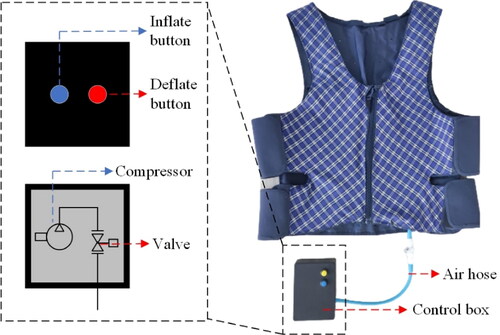
Figure 2. Force Sensing Resistor sensors placement.
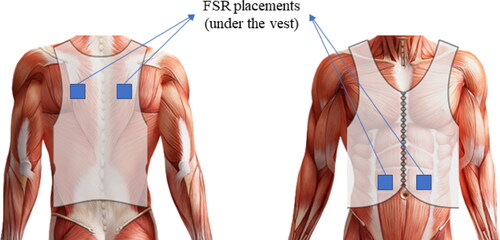
Figure 3. (a) Muse headband overview. (b) The 10–20 system electrode placement.
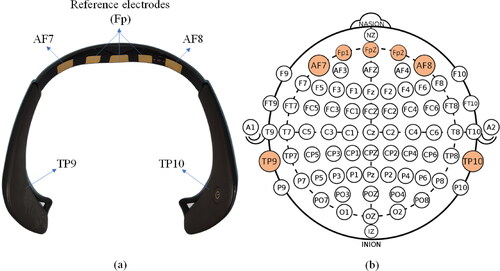
Figure 4. The sequence of procedures used in this study.
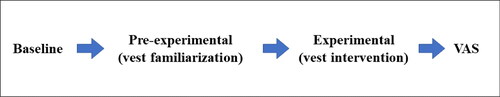
Figure 5. Real experimental scenario.
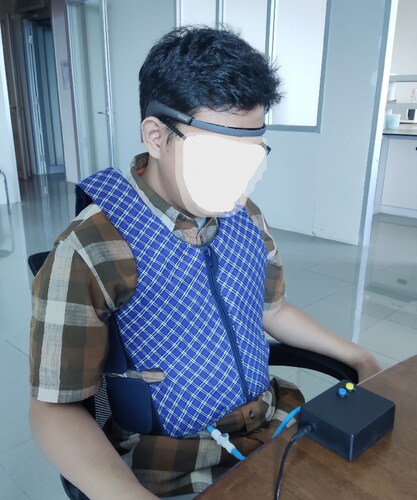
Figure 6. Distribution of prototype VAS categories.
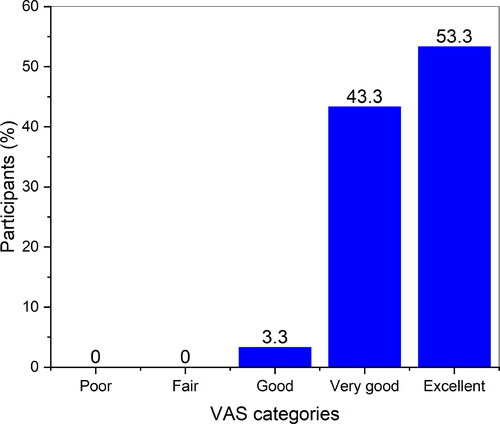
Figure 7. Data distribution of VAS score-mean pressure.
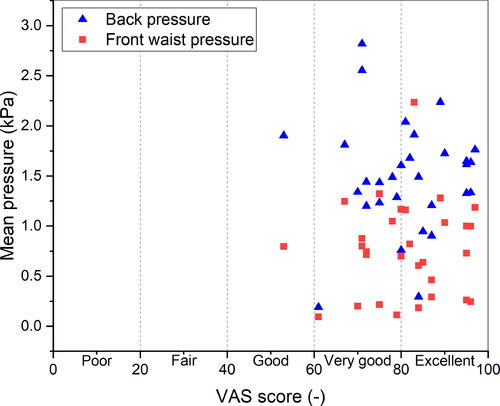
Table 1. The changes of absolute band powers before and during the intervention.
Figure 8. The percentage of increased absolute band powers in each frequency band from baseline to wearing vest.
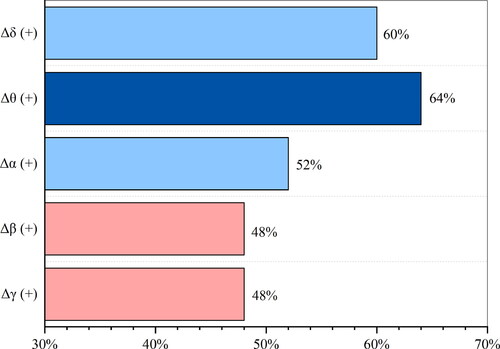
Table 2. Comparison test in the changes of absolute band powers.
Table 3. The comparison of the previous with this present study.