Figures & data
Table 1. Observations made regarding properties of low volume dosage polypropylene fibre concrete.
Figure 1. Experimental program.
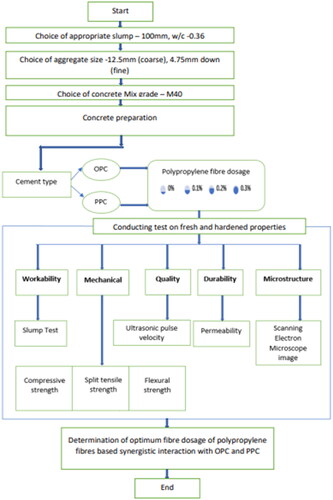
Table 2. Concrete mix designations.
Figure 2. Workability characteristics of PPC and OPC.
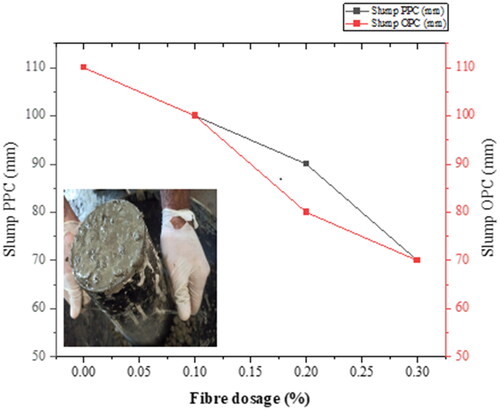
Figure 3. The variation of Concrete strength, quality and with respect to fibre dosage.
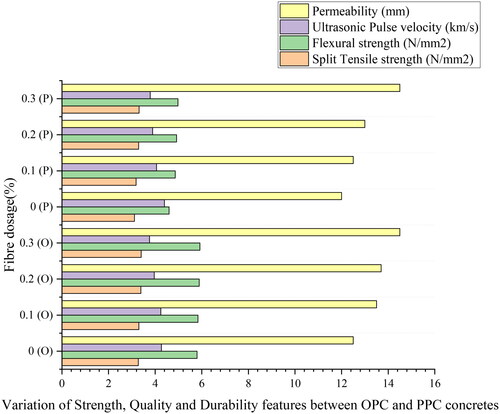
Table 3. Correlation coefficients of PPC concrete.
Table 5. Standard deviation for PPC concrete.
Table 6. Standard deviation for OPC concrete.
Figure 4. Concrete compression test. a. Mixing, b. Concrete collection, c. Casted cubes, e. Compression test, d. Post failure sample.
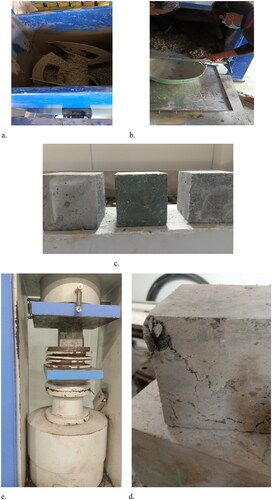
Figure 5. Compressive strength variation of fibrous concrete.
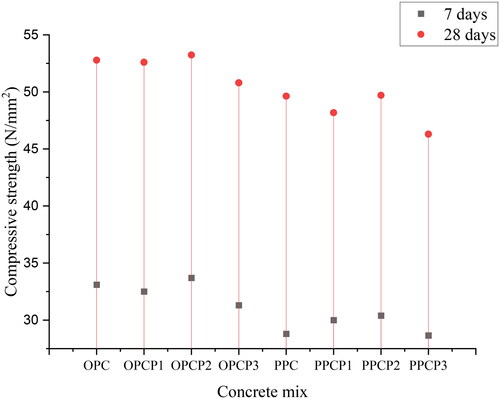
Table 4. Correlation coefficients of OPC concrete.
Figure 6. Evolution of compressive strength of OPC concrete (left) and PPC concrete (right).
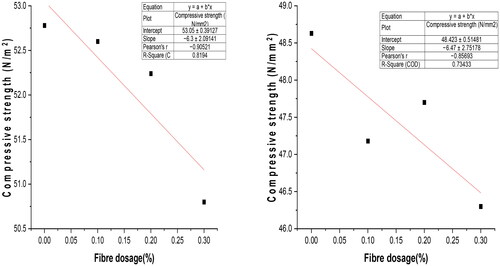
Figure 7. Evolution of Split tensile strength of OPC concrete (left) and PPC concrete (right).
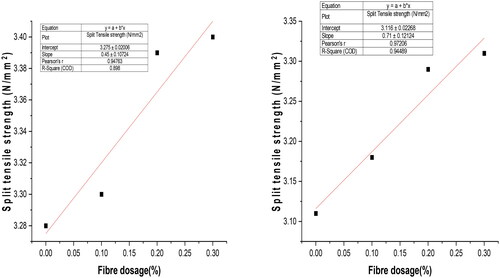
Figure 8. Cylinders post failure –0.3% fibre dosage.
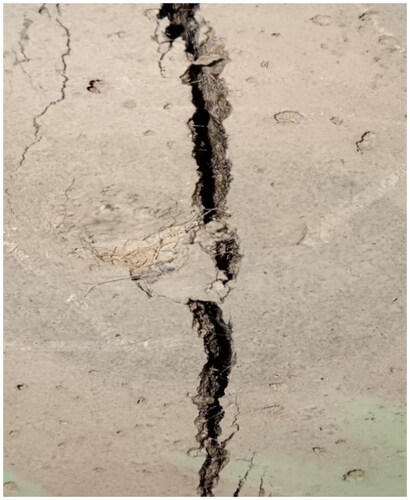
Figure 9. Cylinder testing (left) and Cylinders post failure –0, 0.1% and 0.2% fibre dosage (right).
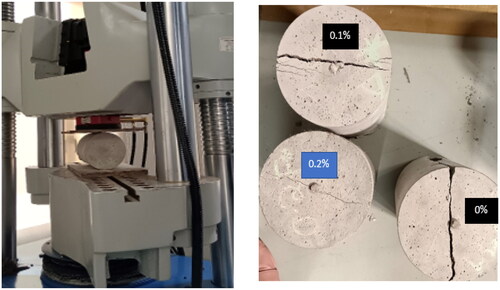
Figure 10. Flexure test on beam specimen.
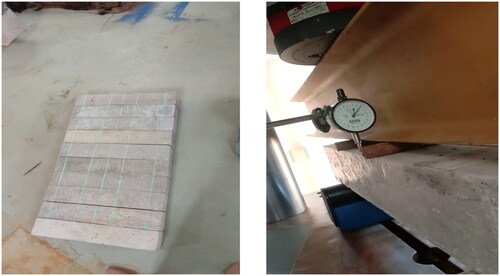
Figure 11. Evolution of Flexural strength of OPC concrete (left) and PPC concrete (right).
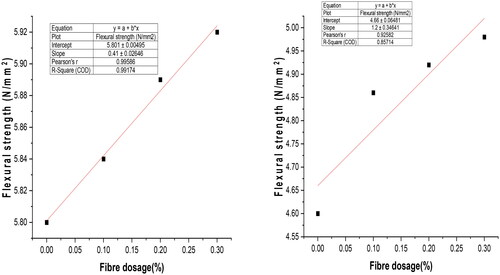
Figure 12. Ultrasonic pulse velocity test.
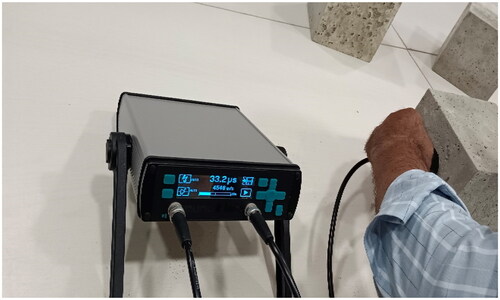
Figure 13. Evolution of ultrasonic pulse velocity for OPC concrete (left) and PPC concrete (right).
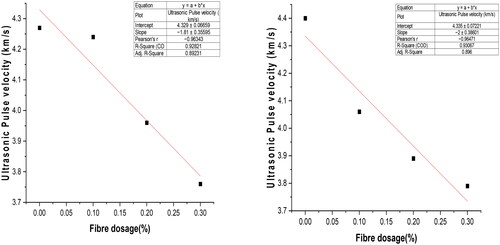
Figure 14. Permeability test.
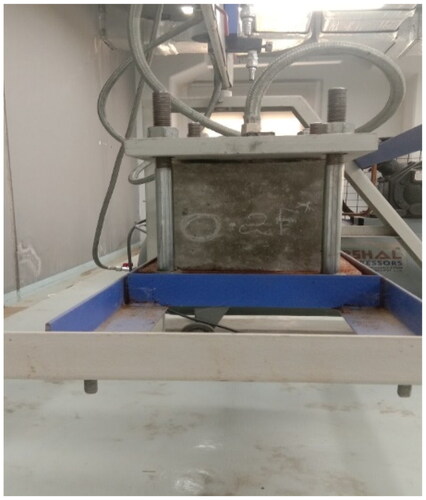
Figure 15. Evolution of water penetration for OPC concrete (left) and PPC concrete (right).
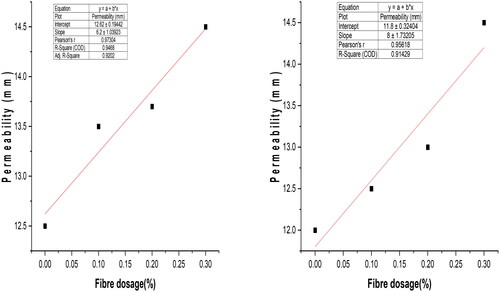
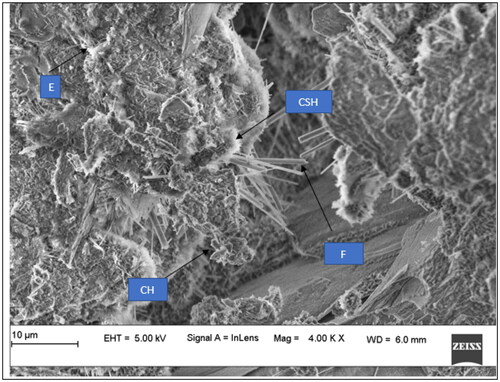
Figure 16. Pores observed in concrete matrix.
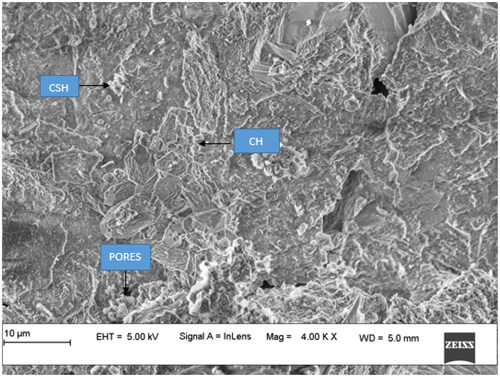
Figure 17. Matrix of semi-porous and non-fibrous PPC concrete.
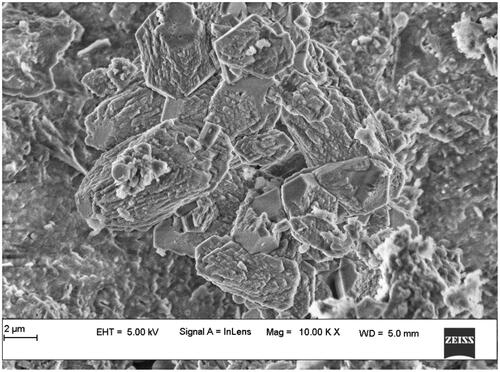
Figure 18. Water pocket formation around fibres.
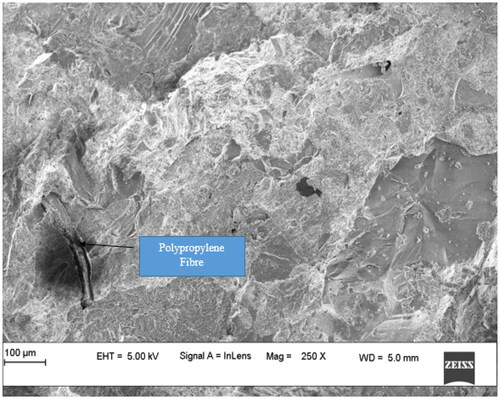
Figure 19. Balling of fibres at 0.3% dosage of PPF.