Figures & data
Figure 1. P20 Prototype image; (a) 3D view and (b) top view with pressure point (Pi, P1 – P6, Po); T1: Turbine 1, T2: Turbine 2; scale 1:8.
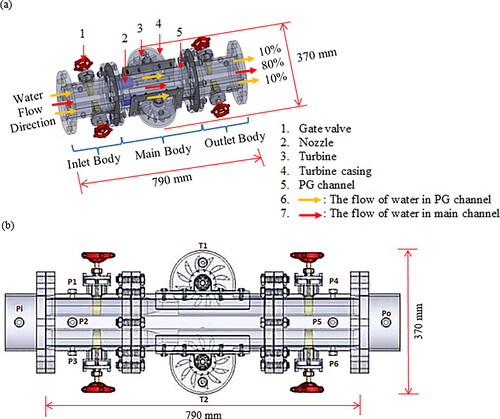
Figure 2. Schematic diagram (dimension in mm); (a) nozzle and (b) turbine.
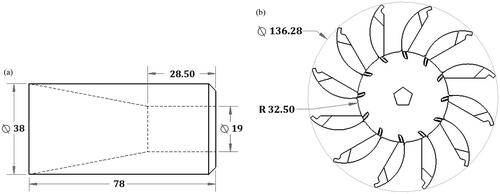
Table 1. Material selection for P20.
Figure 3. Diagram of test rig; (a) schematic drawing and (b) actual image.
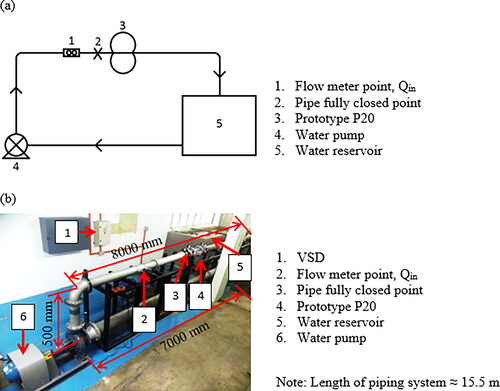
Figure 4. Flow chart of development of P20.
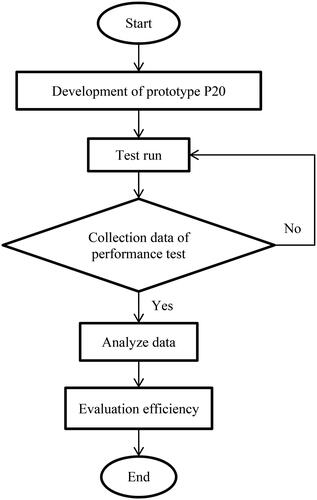
Figure 5. P20 mounted on the test rig with pressure points (Pi, P1–P6 and Po).
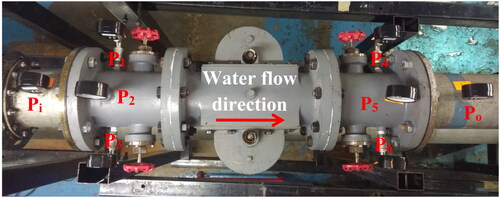
Figure 6. Cross section of P20 main body; (a) schematic drawing and (b) actual image.
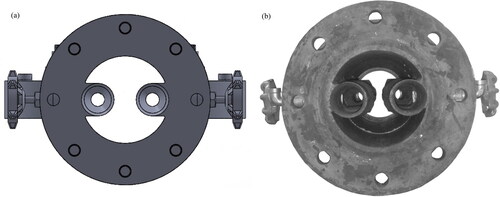
Figure 7. Relationship between stagnation pressure and flow rate.
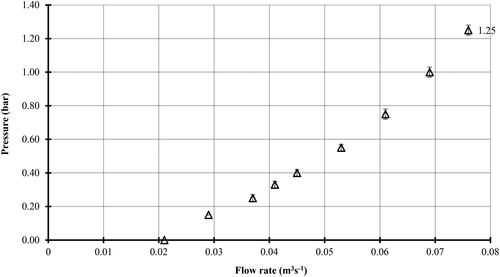
Figure 8. Relationship between hydraulic power and flow rate (from EquationEquation (1)(1)
(1) ).
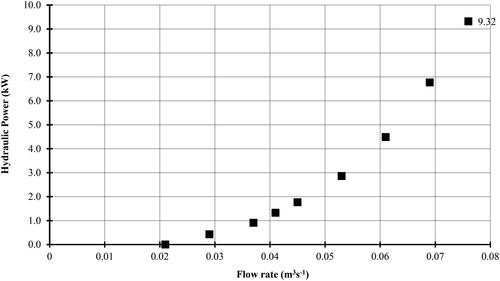
Figure 9. Relationship between pressure (P20) at Pi and flow rate.
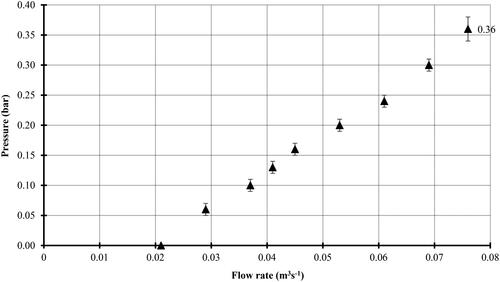
Figure 10. Relationship between pressure (Pst and P20) and flow rate.
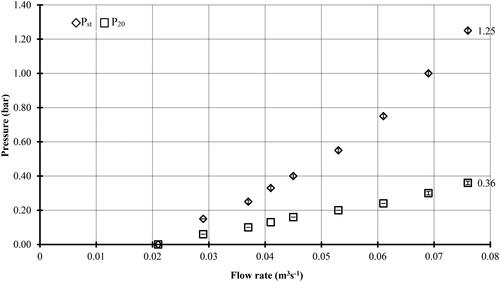
Figure 11. Relationship between pressure loss and flow rate.
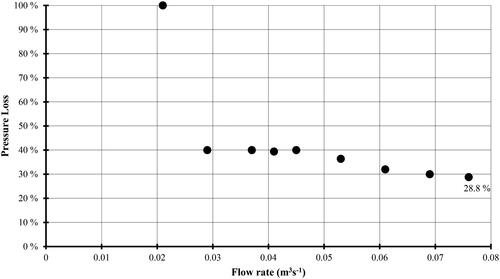
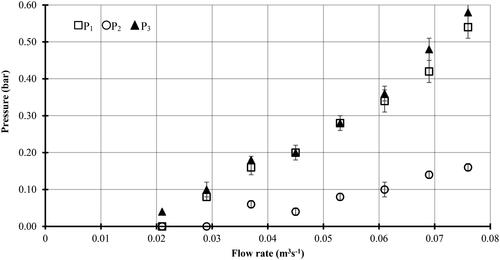
Figure 12. Relationship between pressure and flow rate at prototype when valves are opened.
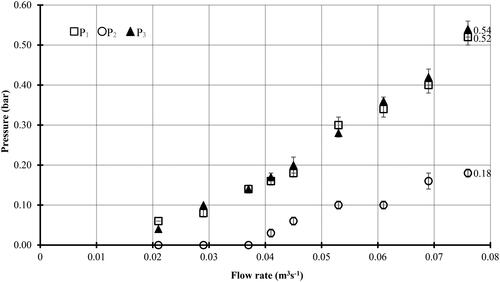
Figure 13. Relationship between turbine rotational speed and flow rate.
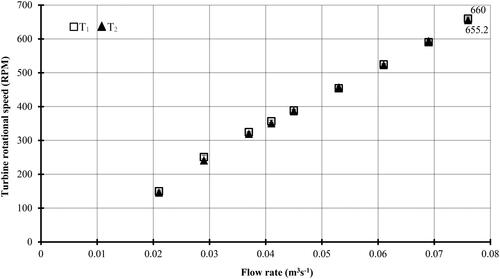
Figure 14. Relationship between torque and turbine rotational speed.
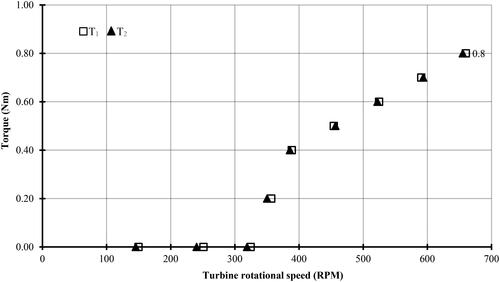
Figure 15. Relationship between mechanical power and flow rate for each turbine.
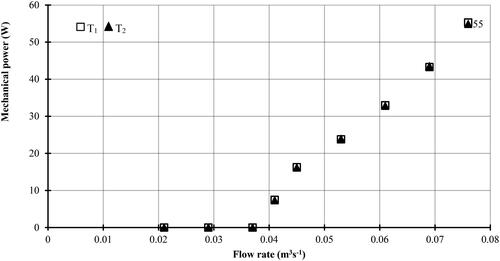
Figure 16. Relationship between turbine efficiency and flow rate.
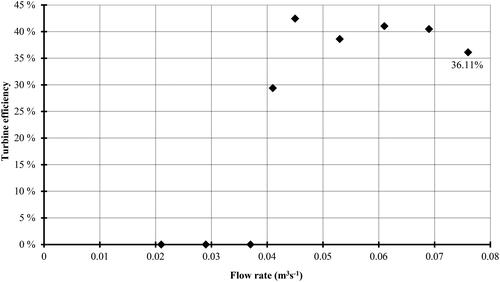
Figure 17. Relationship between turbine efficiency and turbine rotational speed.
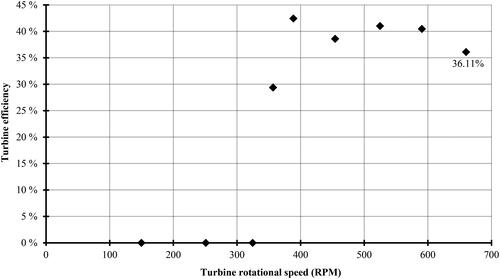
Figure 18. Relationship between turbine efficiency and normalised flow rate.
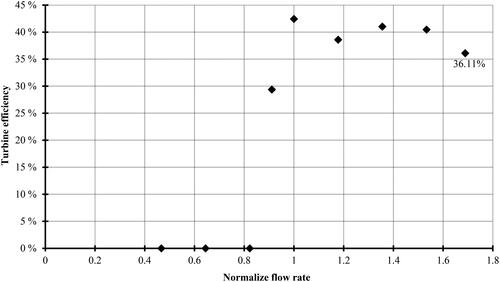
Figure 19. Relationship between mechanical power and tip speed ratio.
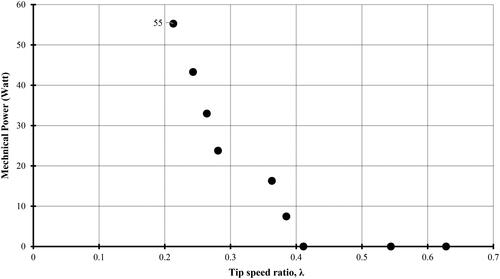
Figure 20. Relationship between turbine efficiency and tip speed ratio.
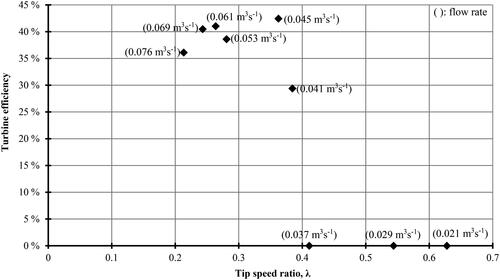
Figure 21. Water splash phenomena in turbine casing.
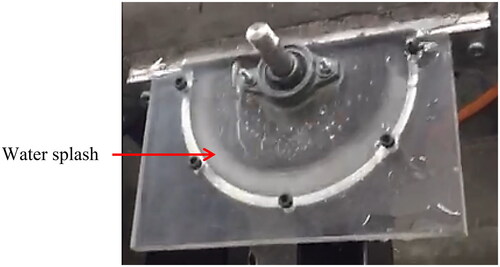
Table 2. Flow and turbine properties.
Figure 22. Relationship between pressure and flow rates.