
Figures & data
Figure 1. Spidron-fractal slot antenna: (a) Front view and (b) Back view.
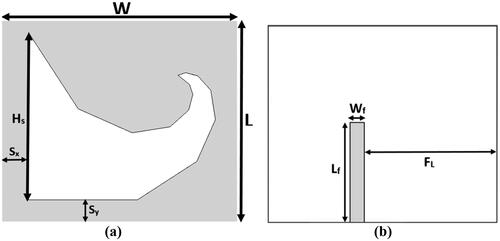
Figure 2. Right angle triangles forming the spidron shape.
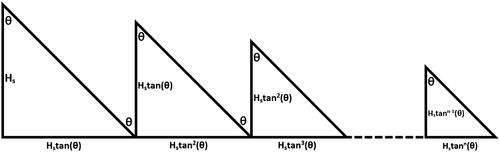
Figure 3. Spidron shape.
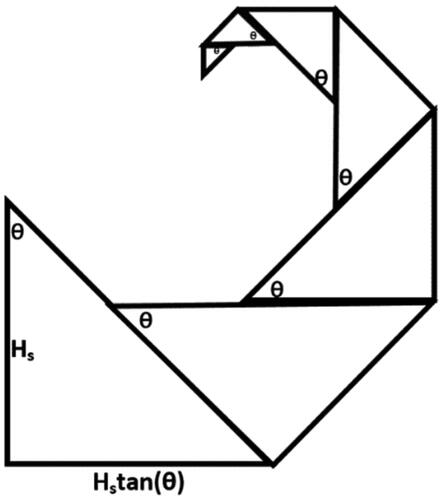
Figure 4. Spidron-fractal slot antenna with rectangular embedded island: (a) Front view and (b) Back view.
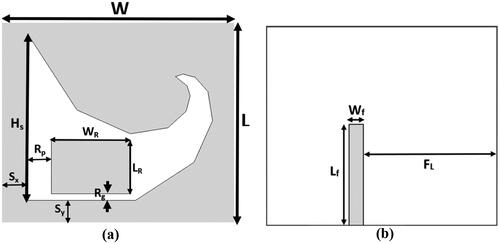
Figure 5. Simulated reflection-coefficient |S11| of the SFSA-NI antenna at different values of FL.
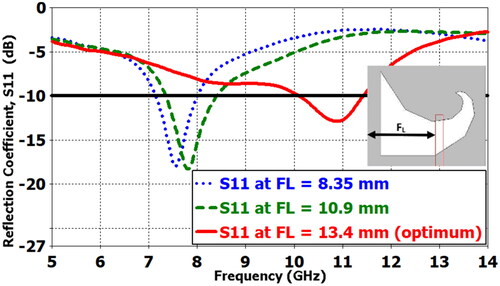
Figure 6. Simulated axial-ratio (AR)| of the SFSA-NI antenna at different values of FL.
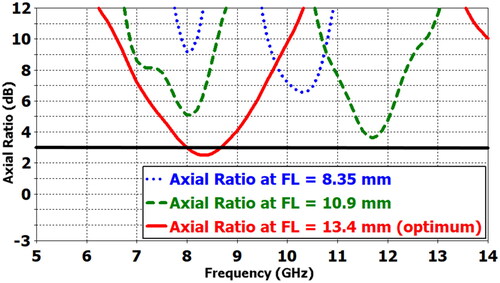
Table 1. optimized dimensions of SFSA-NI antenna.
Table 2. Optimized dimensions of SFSA-RI antenna.
Figure 7. Simulated reflection-coefficient |S11| of the SFSA-RI antenna at different values of LR.
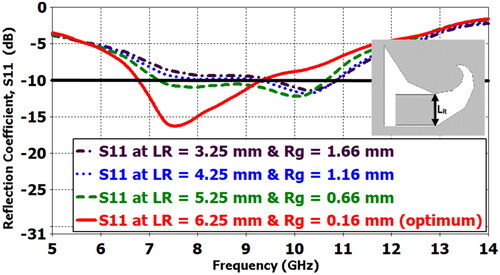
Figure 8. Simulated axial-ratio (AR) of the SFSA-RI antenna at different values of LR.
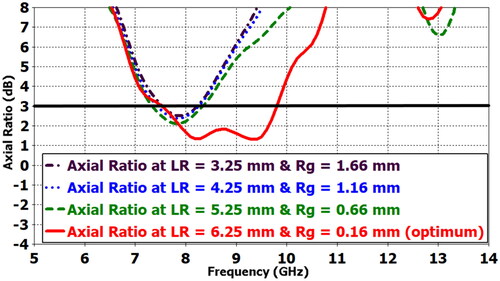
Figure 9. Simulated reflection-coefficient |S11| of the SFSA-RI antenna at different values of WR.
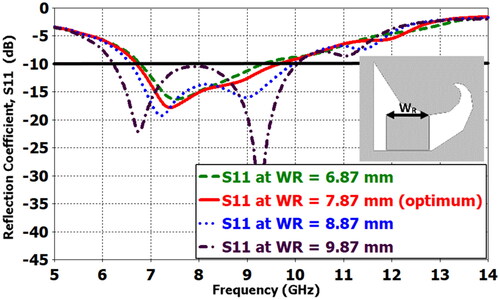
Figure 10. Simulated axial-ratio (AR) of the SFSA-RI antenna at different values of WR.
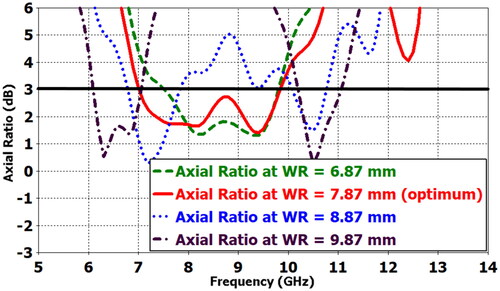
Figure 11. Simulated reflection-coefficient |S11| of the SFSA-RI antenna at different values of RP.
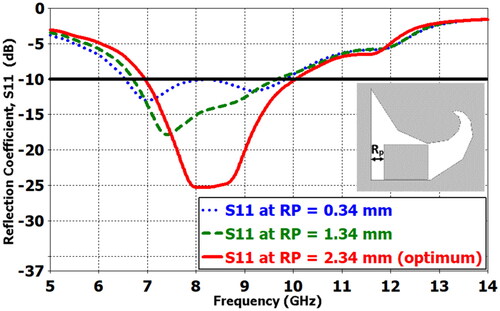
Figure 12. Simulated axial-ratio (AR) of the SFSA-RI antenna at different values of RP.
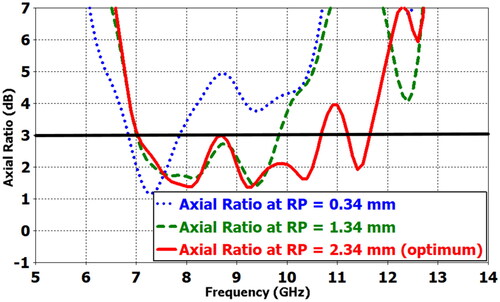
Figure 13. Fabricated SFSA-RI antenna: (a) Front view, (b) Back view.
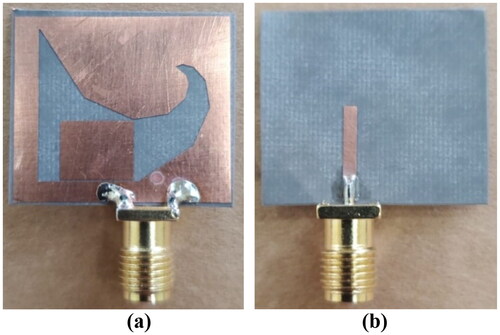
Figure 14. Fabricated SFSA-RI antenna measurement in the anechoic chamber.
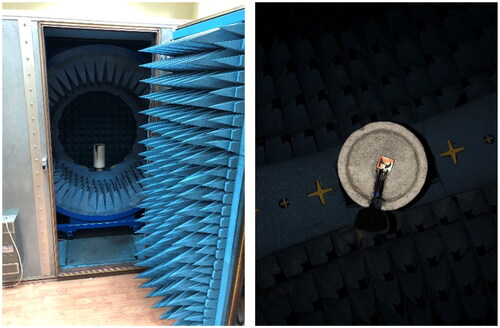
Figure 15. Simulated surface current distribution at 7.5 GHz of the SFSA-RI antenna with embedded island at phase: (a) 0°, (b) 90°, (c) 180°, (d) 270°.
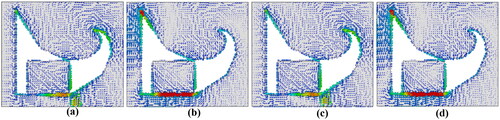
Figure 16. Simulated surface current distribution at 8.15 GHz of the SFSA-RI antenna with embedded island at phase: (a) 0°, (b) 90°, (c) 180°, (d) 270°.
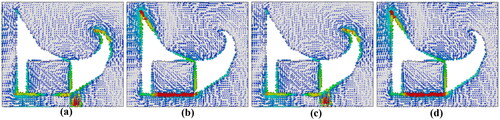
Figure 17. Simulated surface current distribution at 9 GHz of the SFSA-RI antenna with embedded island at phase: (a) 0°, (b) 90°, (c) 180°, (d) 270°.
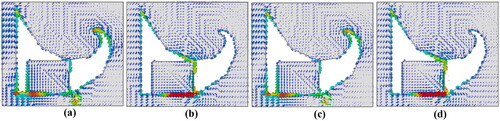
Figure 18. Simulated and measured LHCP and RHCP, radiation patterns at 7.5 GHz: (a) E-plane (phi = 0°), (b) H-plane (phi = 90°).
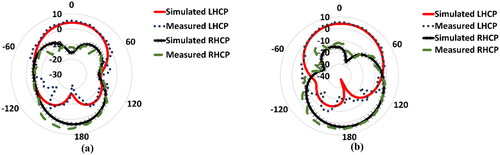
Figure 19. Simulated and measured LHCP and RHCP, radiation patterns at 8.15 GHz: (a) E-plane (phi = 0°), (b) H-plane (phi = 90°).
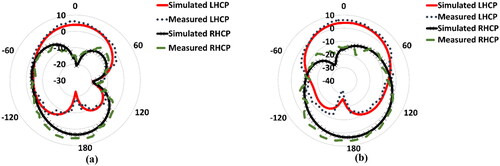
Figure 20. Simulated and measured LHCP and RHCP, radiation patterns at 9 GHz: (a) E-plane (phi = 0°), (b) H-plane (phi = 90°).
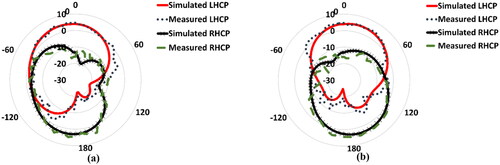
Figure 21. Measured vs simulated radiation pattern polar plot (theta vs dBi): (a) E-plane (phi = 0) at 7.5 GHz, (b) H-plane (phi = 90) at 7.5 GHz, (c) E-plane (phi = 0) at 8.15 GHz, (d) H-plane (phi = 90) at 8.15 GHz, (e) E-plane (phi = 0) at 9 GHz, (f) H-plane (phi = 90) at 9 GHz.
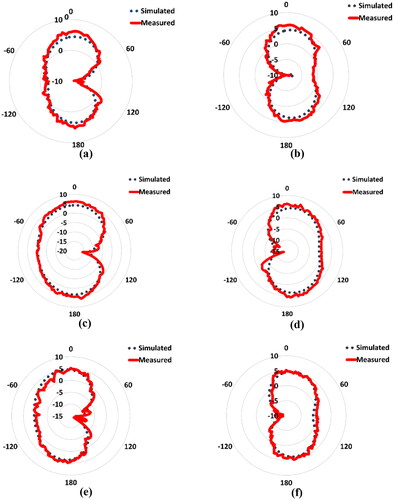
Figure 22. Measured vs simulated reflection-coefficient |S11| of the SFSA-RI antenna.
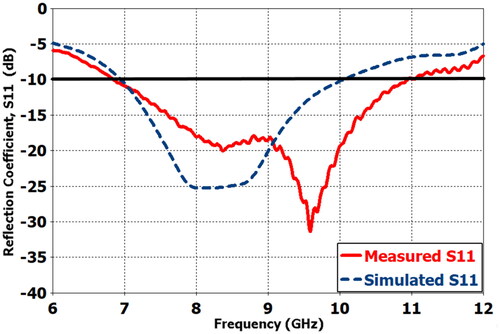
Figure 23. Measured vs simulated axial-ratio (AR) of the SFSA-RI antenna.
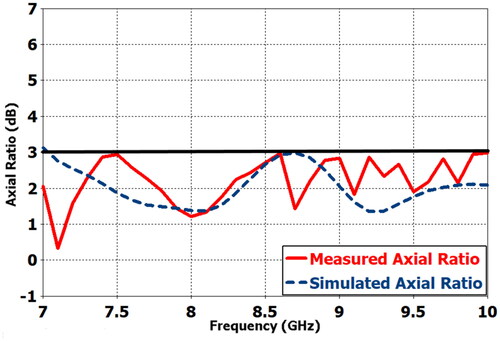
Figure 24. Measured vs simulated gain of the SFSA-RI antenna.
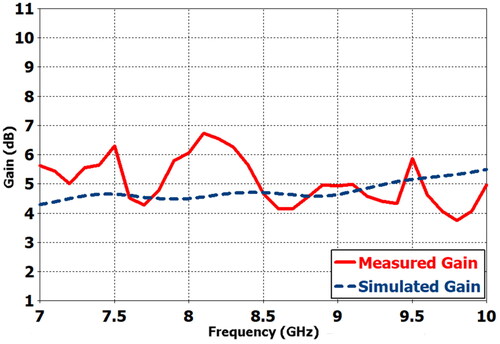
Figure 25. Measured vs simulated antenna efficiency of the SFSA-RI antenna.
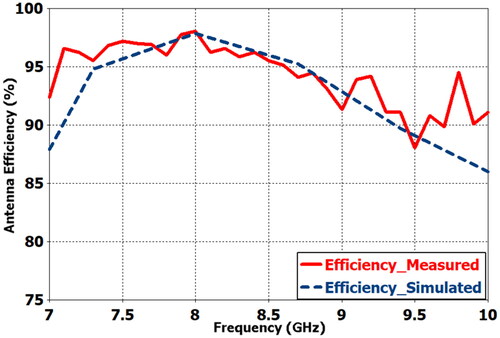
Table 3. Comparison with most recent designs of X-band antennas.
Data availability statement
The data that support the findings of this study are available from the corresponding author, Mostafa Mahmoud Rabie, upon reasonable request.