Figures & data
Figure 1. Multi-vector analysis of the information image of health care.
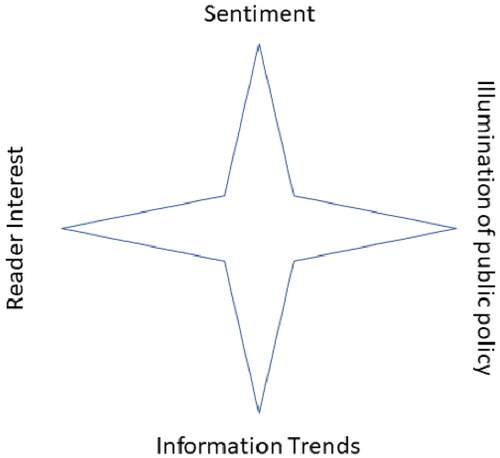
Figure 2. Rating of topics by attractiveness to readers.
Figure 3. A corpus of media documents. The percentage of content and number of articles in the corpus in thousands are given for each source.
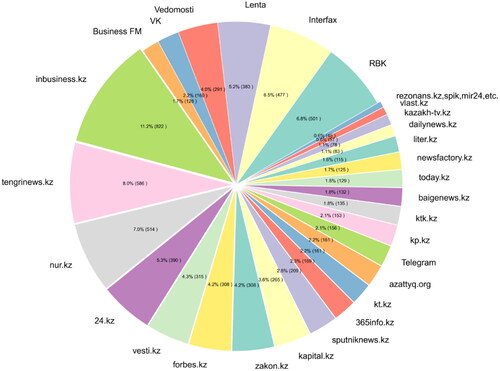
Figure 4. The topic groups of texts ranked according to the degree of weight in the sub-corpus of texts devoted to health care.
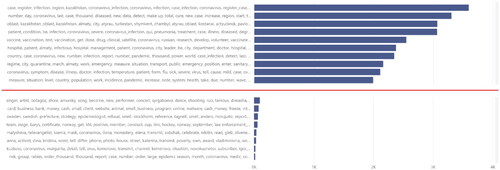
Figure 5. Topic groups of media articles on health care, ranked by topic attractiveness.
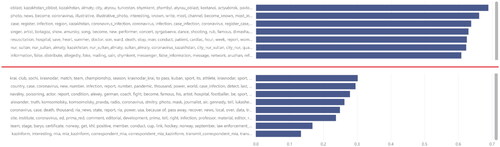
Figure 6. Dynamics of the publication activity on the topic ‘Incidence, School, Child, Growth, Epidemiological’.
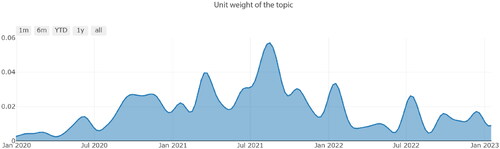
Figure 7. Dynamics of the publication activity on the topic ‘Vaccination, Vaccines, COVID”.
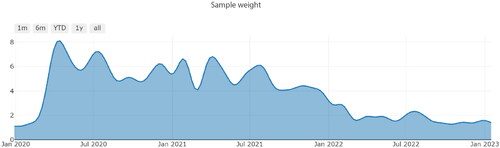
Figure 8. Dynamics of the publication activity on the topic ‘Remedy, Medicinal, Drug, Medicine, Medicinal_Remedy’.
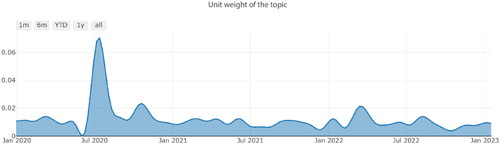
Figure 9. Dynamics of the publication activity on the topic ‘Fake, False Information, Disinformation’.
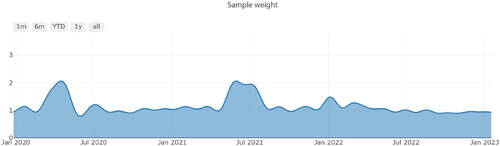
Figure 10. Dynamics of the publication activity on the topic ‘Crisis, Lending, Debt, Microcredit’.
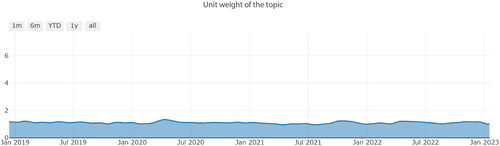
Figure 11. Dynamics of the publication activity on the topic ‘Case, Register, Coronavirus, Infec-tion, Coronavirus_Infection’.
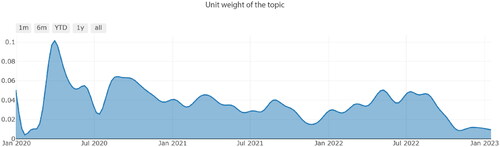
Figure 12. Imbalance across the corpus of news and health code.
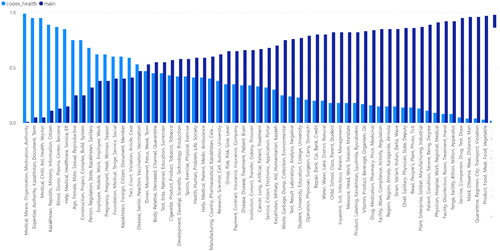
Figure 13. Imbalance across the corpus of news and health code.
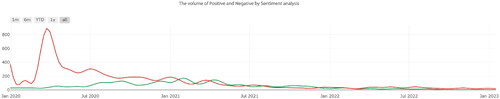
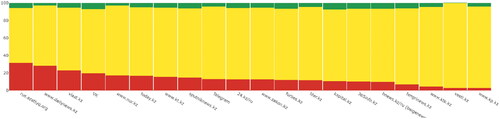
Figure 14. Negative and positive media on the topic of health care, January 2023. The articles of a positive sentiment are shown in green, negative in red, and articles of a neutral sentiment are in yellow in the total volume of media articles.