
Figures & data
Table 1. Basefluid properties.
Figure 1. HRTEM pictograph of (a) pristine CNTs, (b) treated CNTs, c) GNPs.
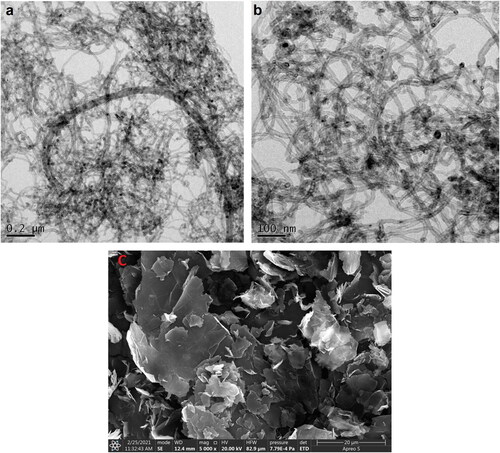
Table 2. Basefluid compositions.
Figure 2. Zeta Potential of pure ethylene glycol dispersed with a) pristine 0.5% CNT–GNP on the first day and b) pristine CNT–GNP on the 5th day.
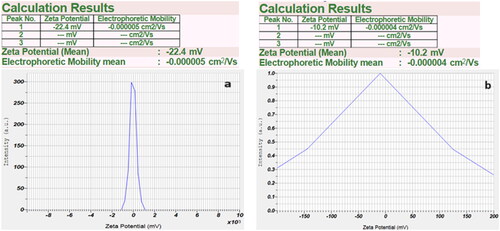
Figure 3. Zeta Potential of pure ethylene glycol dispersed with a) oxidized 0.5% CNT–GNP on the first day and b) oxidized CNT–GNP on the 60th day.
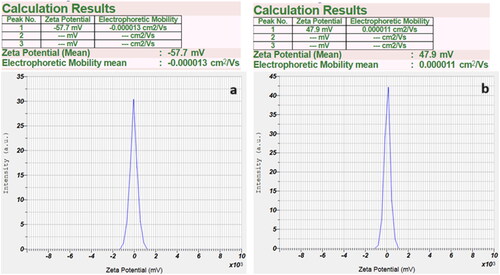
Table 3. Pristine CNT–GNP zeta potential values.
Table 4. Oxidized CNT–GNP zeta potential values.
Figure 4. Zeta Potential of pure ethylene glycol dispersed with 0.5% CNT–GNP surface modified with CTAB with a ratio of (2:1) on a) the first day and b) the 60th day.
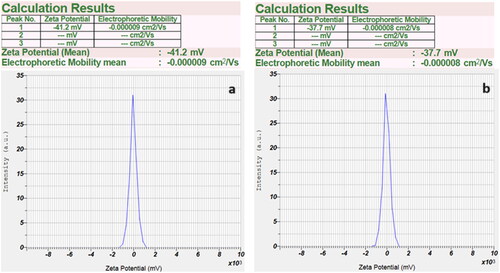
Figure 5. Zeta Potential of pure ethylene glycol dispersed with 0.5% CNT–GNP surface modified with SDS with a ratio of (3:1) on a) the first day and b) the 60th day.
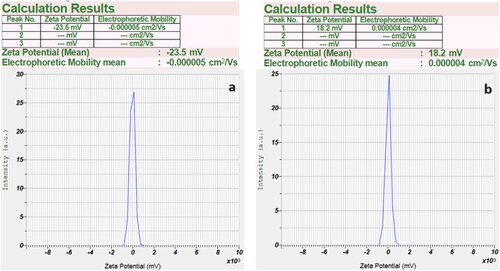
Figure 6. Zeta potential variation across 60 days using SDS and CTAB for a) 0.5% EG–water (80:20) and b) 0.5% pure EG.
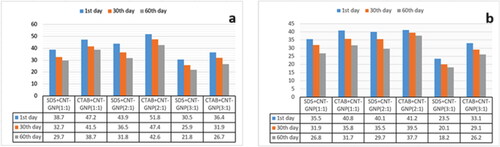
Figure 7. Variation of thermal conductivity for pristine CNT–GNP for a) EG–water (80:20) and b) Pure EG.
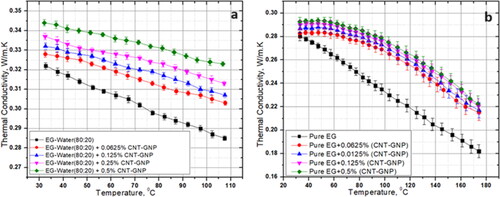
Figure 8. Dynamic viscosity variation of pristine CNT–GNP dispersed in a) EG–water (80:20) and b) Pure EG.
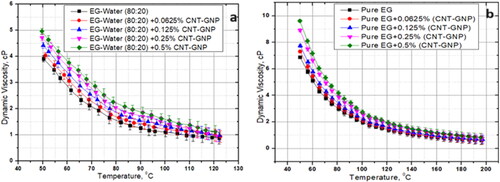
Figure 9. Thermal conductivity variation across pristine, SDS, CTAB, and Oxidized CNT–GNP dispersed in EG–water (80:20) for a) 0.0625% b) 0.0125% c) 0.25% d) 0.5%.
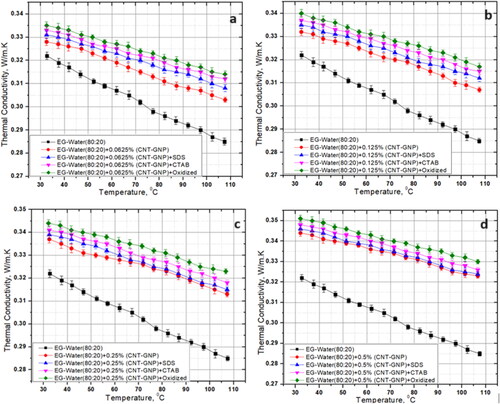
Figure 10. Thermal conductivity variation across pristine, SDS, CTAB, and oxidized CNT–GNP dispersed in pure EG for a) 0.0625%, b) 0.0125%, c) 0.25%, d) 0.5%.
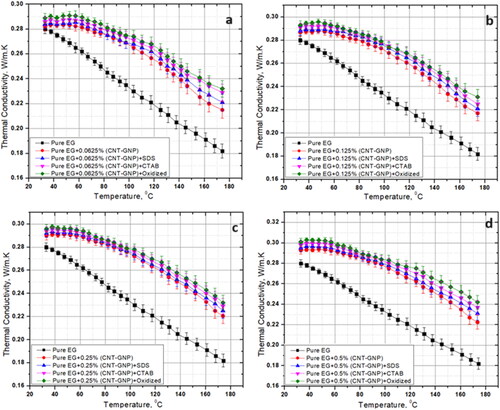
Figure 11. Thermal conductivity variation with temperature for nanofluids dispersed with surfactants for a) EG–water (80:20) and b EG 100%.
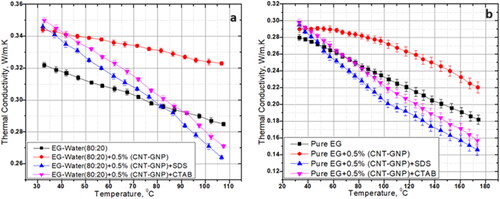
Figure 12. Variation of viscosity with temperature for nanofluids dispersed with surfactants for a) EG–water (80:20) and b) Pure EG.
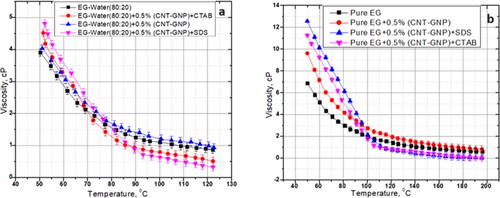
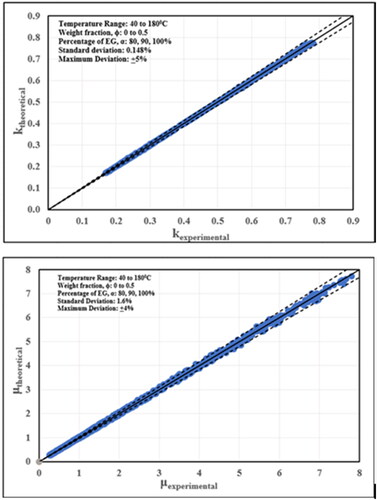
Figure 13. Validation of correlation formulas for a) thermal conductivity and b) dynamic viscosity.
Data availability statement
The data that support the findings of this study are available from the corresponding author, V. Srinivas, upon reasonable request.