Figures & data
Table 1. Concrete mix highlights.
Figure 1. Process of piles casting.
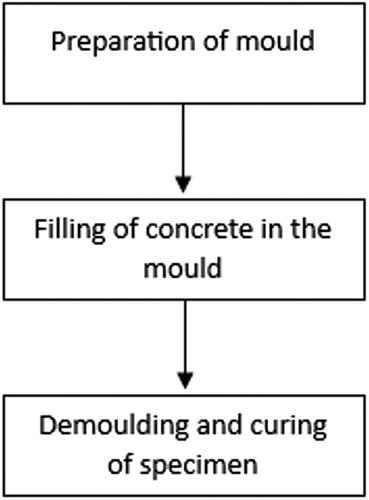
Figure 2. Galvanized iron mould with rubber for pile with helical grooves.
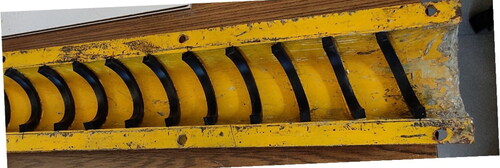
Figure 3. Galvanized iron mould and Fe500 8 mm diameter rebar for plain pile.
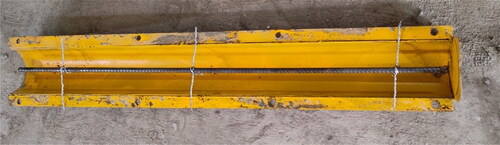
Figure 4. (a) Demoulding of the pile with helical groove specimen. (b) Pile with the helical groove test specimen.
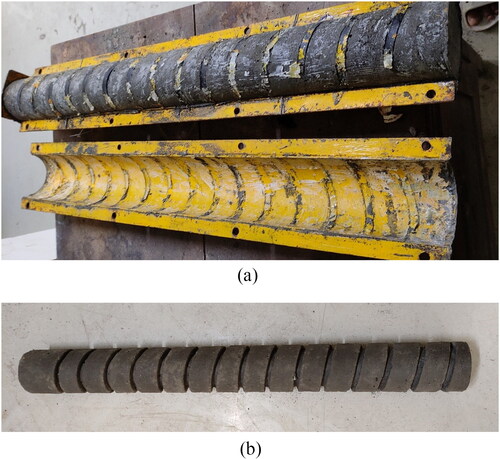
Figure 5. (a) Control pile P0, (b) RCC pile with helical grooves P50, (c) RCC pile with helical grooves P75, and (d) RCC pile with helical grooves P100.
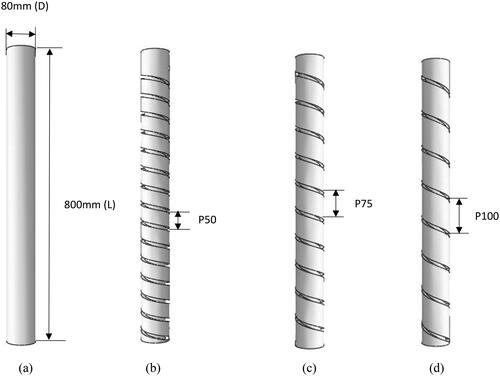
Figure 6. The axial load test setup (a) line diagram of the testing tank and (b) dial gauges, sand, and pile.
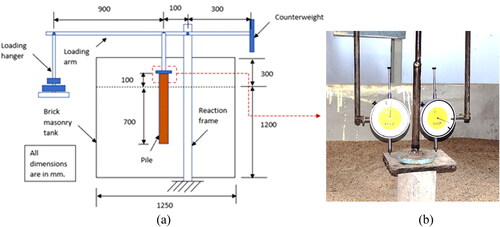
Table 2. Physical properties of cohesionless soil.
Figure 7. The lateral load test setup (a) line diagram of the setup and (b) steel rope, dial gauge, sand, and pile.
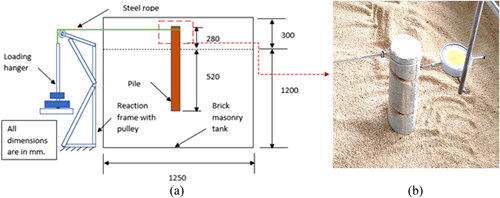
Figure 8. Process of numerical simulation.
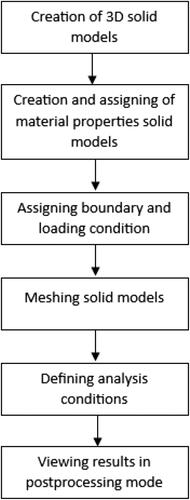
Table 3. Mechanical properties of cohesionless soil and pile.
Figure 9. 3D continuum model.
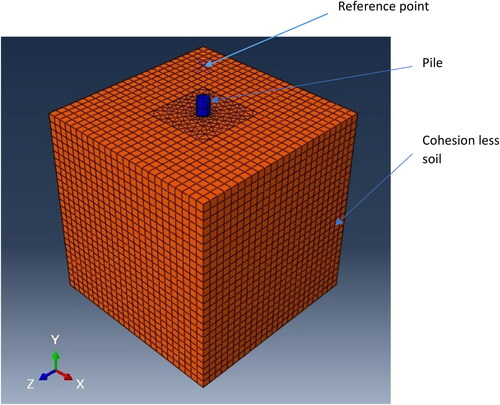
Figure 10. Master and slave surface for interaction.
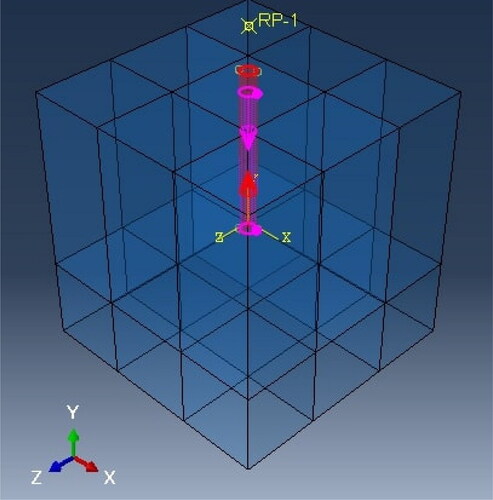
Figure 11. Mesh size vs. Von Mises stress in soil.
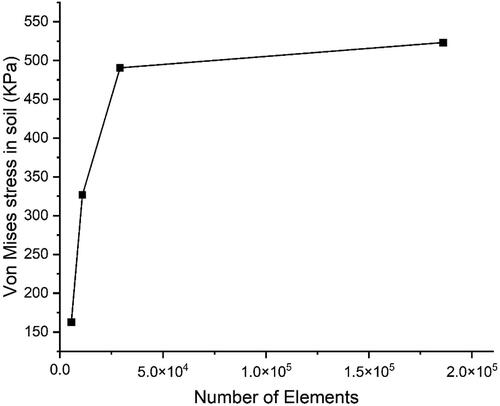
Figure 12. Boundary condition.
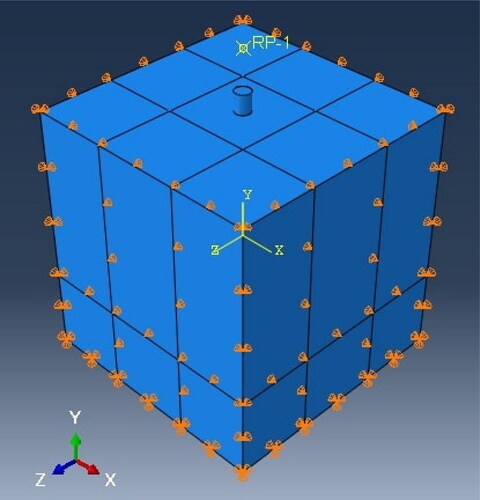
Figure 13. Geostatic stress in soil.
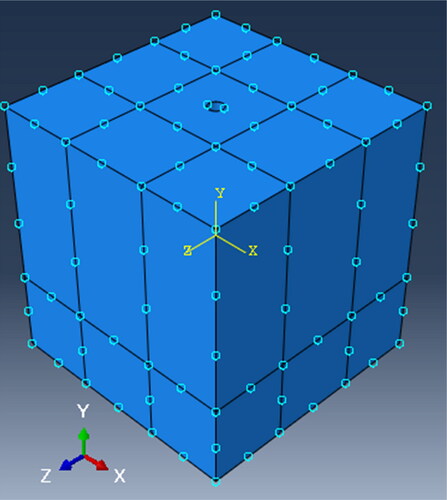
Figure 14. (a) Control pile subjected to axial load showing displacement of soil particles and (b) end bearing as pressure bulb.
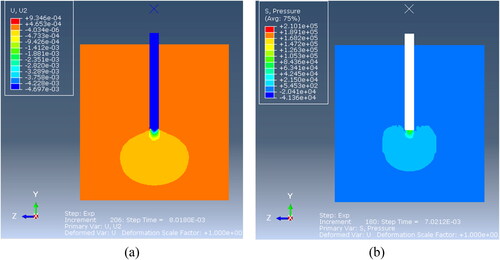
Figure 15. (a) P100 helical groove pile subjected to axial load showing displacement of soil particles and (b) end bearing pressure and pressure at groove interlocks.
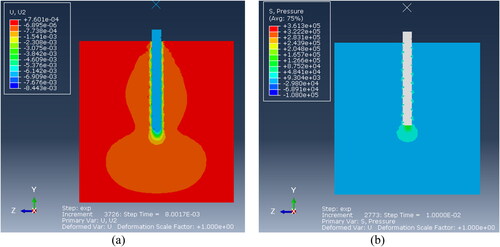
Figure 16. (a) P75 helical groove pile subjected to axial load showing displacement of soil particles and (b) end bearing pressure and pressure at groove interlocks.
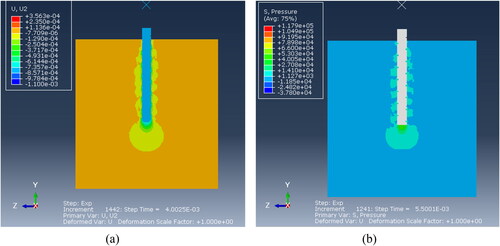
Figure 17. (a) P50 helical groove pile subjected to axial load showing displacement of soil particles and (b) end bearing pressure and pressure at groove interlocks.
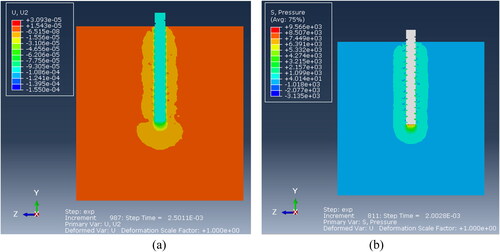
Figure 18. The axial force of pile vs. depth of pile.
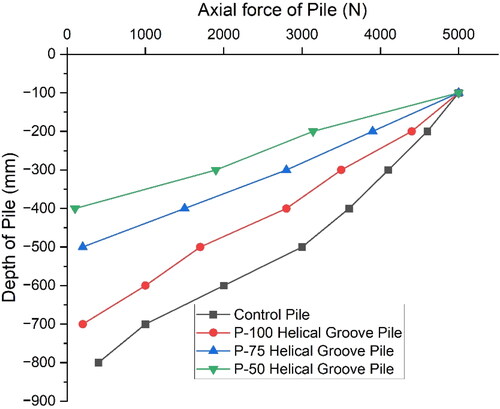
Figure 19. Load vs. settlement curves of piles subjected to axial load.
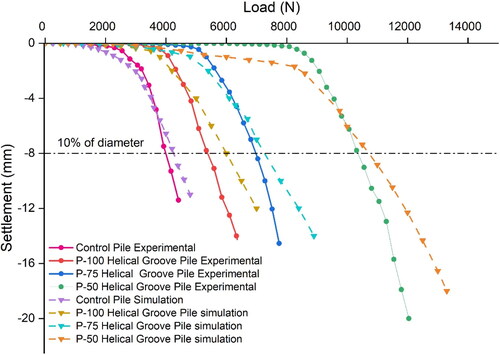
Table 4. The percentage volume of groove for a pitch of the helix.
Table 5. End bearing and shaft resistance.
Figure 20. P-50 RCC pile with helical grooves subjected to lateral load.
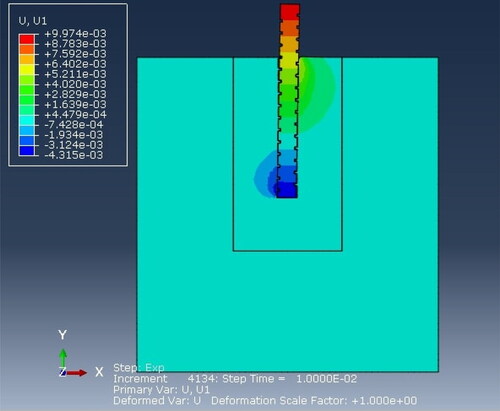
Figure 21. Lateral displacement vs. depth of pile.
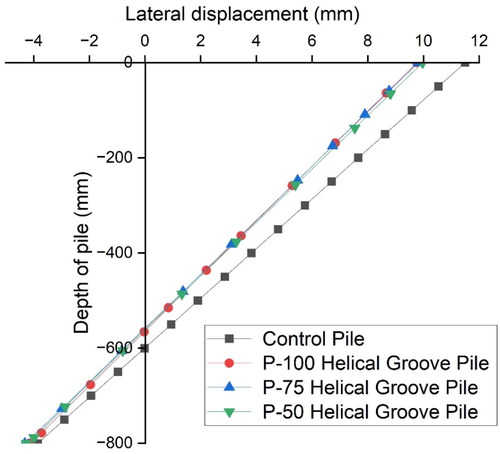
Figure 22. Lateral load vs. lateral displacement curves of piles.
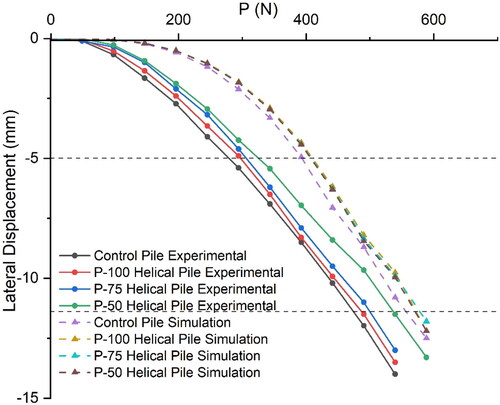
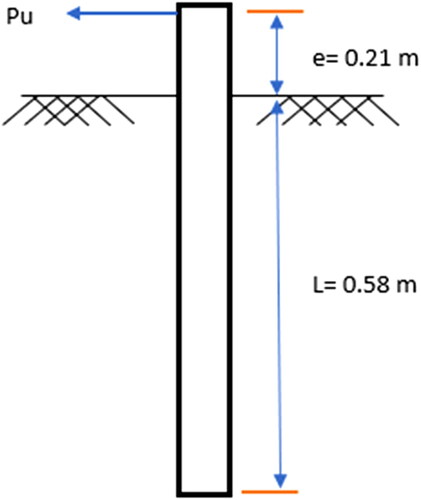
Figure 23. Lateral load schematic diagram.