
Figures & data
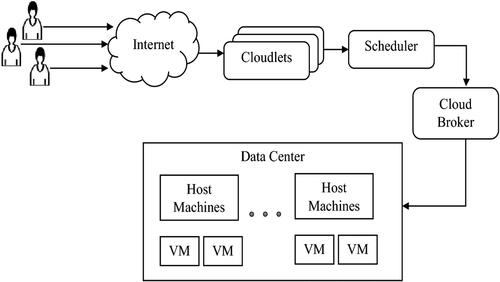
Figure 1. Task scheduling model through cloud computing.
Table
Figure 2. State-space vs objective function.
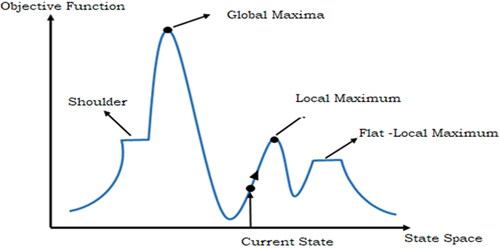
Figure 3. Hybrid hill climbing algorithm.
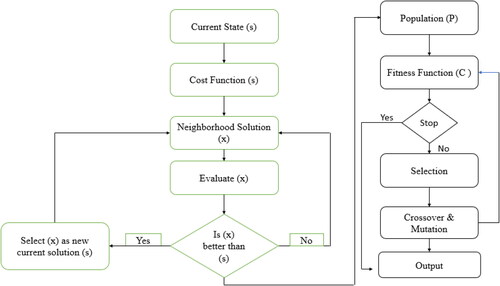
Table 1. Cost function calculation for J1 and L1 benchmark problems.
Figure 4. Population, chromosome, and genes in the genetic algorithm.
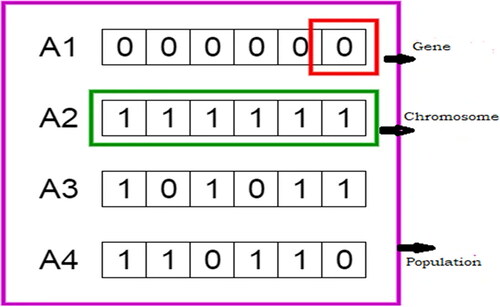
Figure 5. The crossover position within the genetic algorithm.
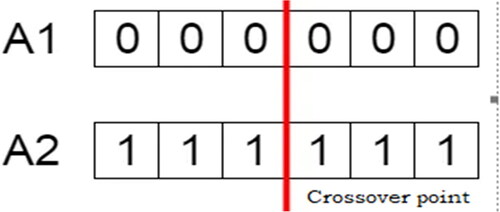
Figure 6. The mutation process within a GA.
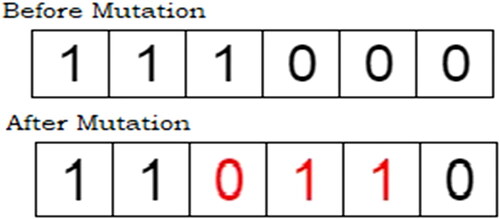
Table 2. Benchmark problems calculation for neighbor sequence.
Table 3. Cost function through hill-climbing algorithm.
Table 4. Cost function through the hybrid algorithm.
Table 5. Percentage improvement between CDS and HCS.
Table 6. Percentage improvement between HCS and GHCS.
Table 7. Simulation cloud environment 1.
Table 8. Simulation cloud environment 2.
Table 9. Comparison with the results of CDS, HCA, and GAHCA at a significant level a = 0.05.
Table 10. Ranks according to Friedman test.
Figure 7. Number of jobs vs performance matrix for layout 1.
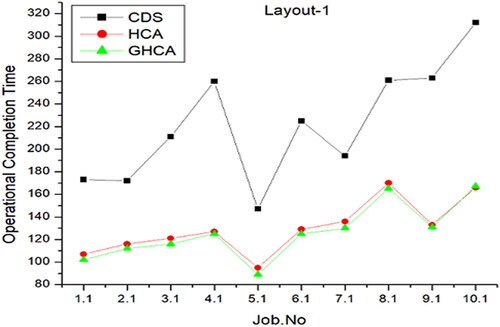
Figure 8. Number of jobs vs performance matrix for layout 2.
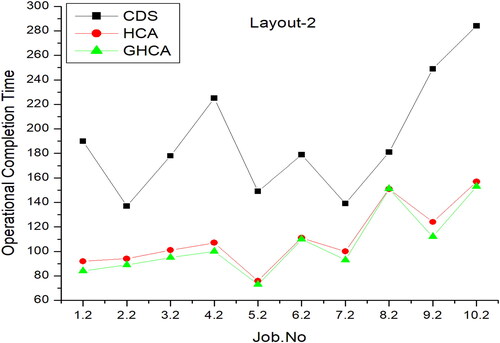
Figure 9. Number of jobs vs performance matrix for layout 3.
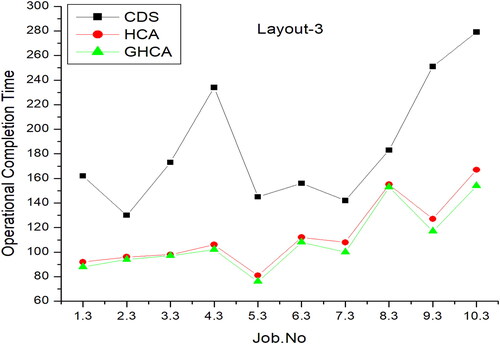
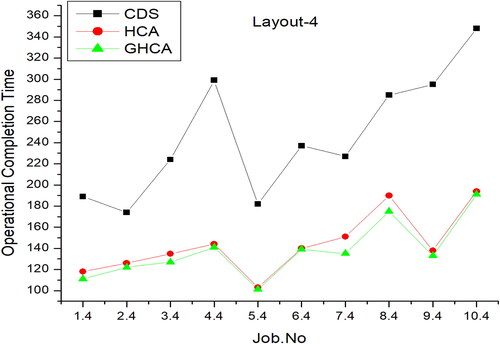
Figure 10. Number of jobs vs performance matrix for layout 4.
Data availability statement
The original contributions presented in the study are included in the article; further inquiries can be directed to the corresponding author.