
Figures & data
Figure 1. (a) Single V-groove GMAW welded butt joint (b) Al 6061-T6 welded plate.
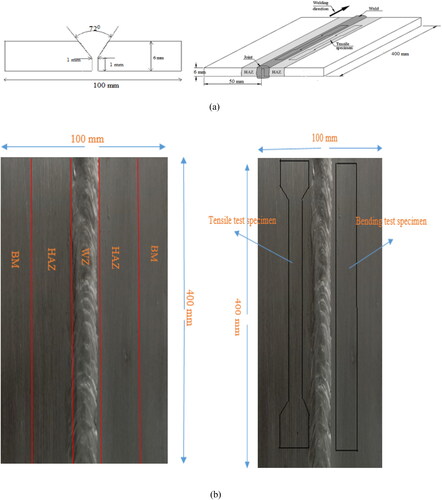
Table 1. Chemical composition of ER-5356 and Al6061-T6.
Table 2. Welding Parameters of GMAW welding for Al 6061-T6 as per WPS.
Figure 2. Microhardness profile of the GMAW welded Al 6061-T6 specimen.
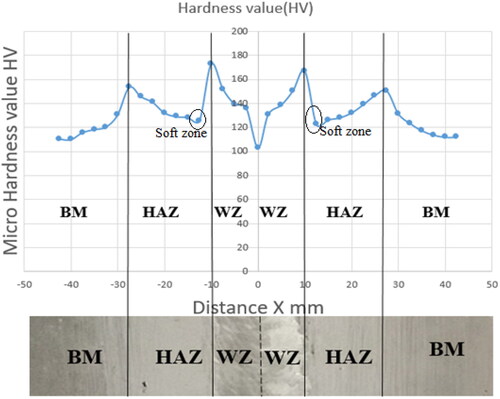
Table 3. X-ray radiography films.
Figure 3. Universal testing machine.
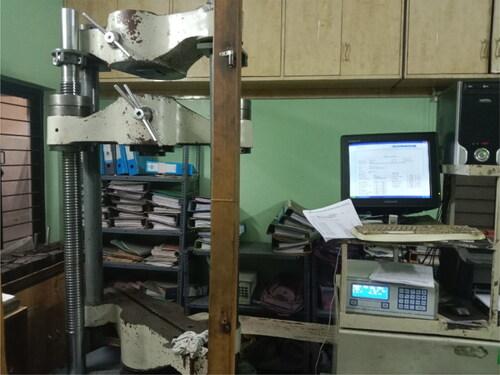
Figure 4. (a) The detailed specification of tensile and bending test specimens and (b) tensile and bending test specimens.
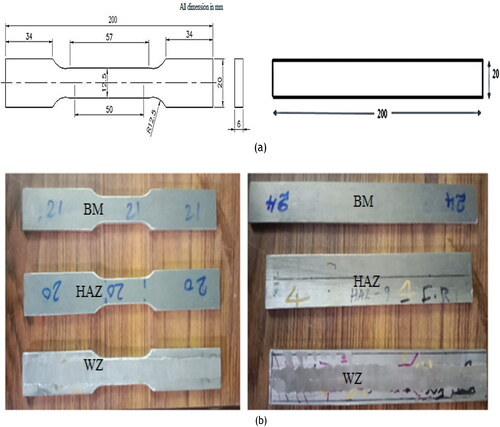
Table 4. The tensile test result of Al 6061-T6 GMAW welded samples.
Figure 5. Fractured surface of tensile test specimens.
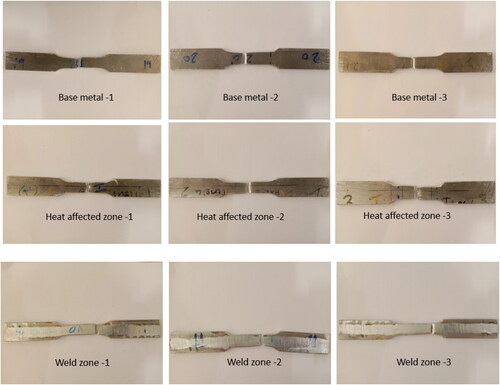
Figure 6. Compact tension test specimen for FCG test.
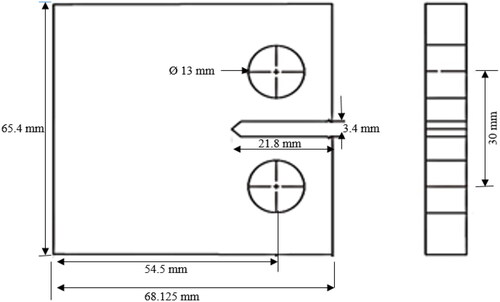
Figure 7. Location of WZ, HAZ and in Al 6061-T6 GMAW welded plate.
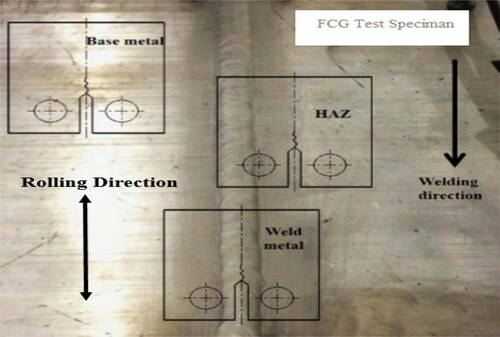
Table 5. The parameters used in the FCG test.
Table 6. FCG Test result of Al 6061 T-6 GMAW welded specimen.
Figure 8. da/dN v/s ΔK for BM.
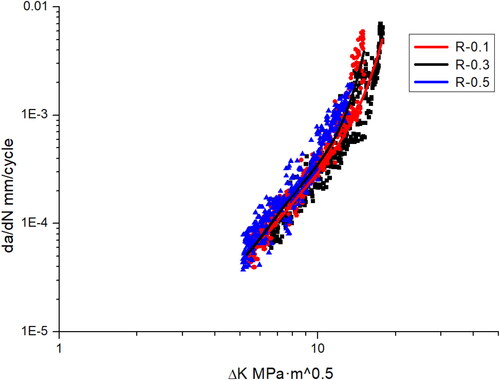
Figure 9. Crack length (a) v/s Number of cycles(N) for BM.
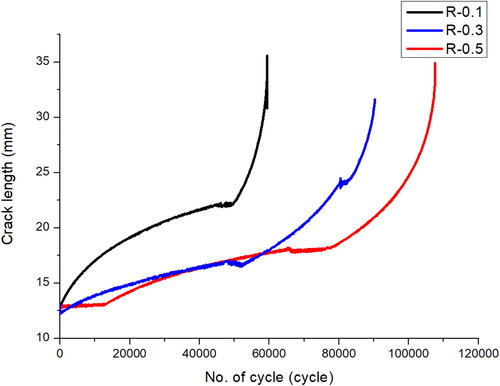
Figure 10. da/dN v/s ΔK for HAZ.
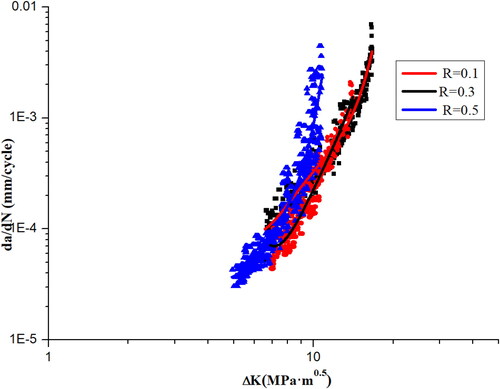
Figure 11. a v/s N for HAZ.
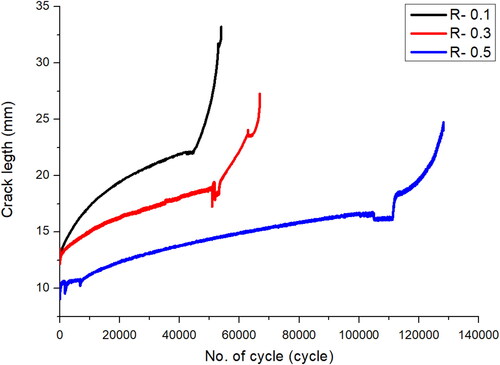
Figure 12. da/dN v/s ΔK for WZ.
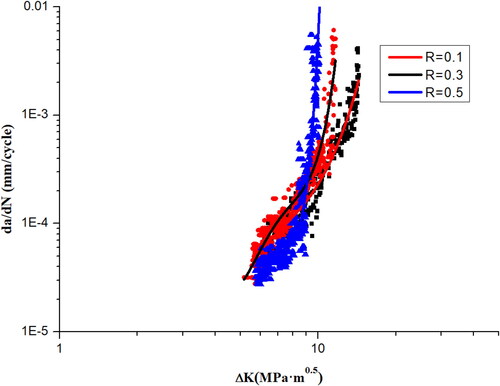
Figure 13. a v/s N for WZ.
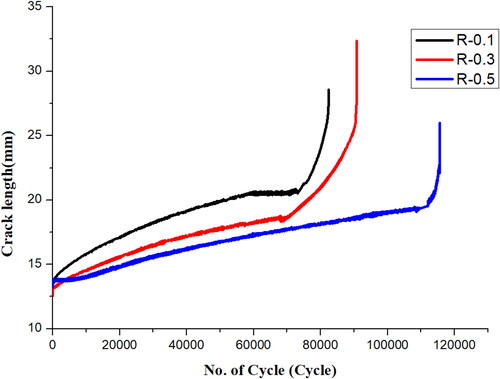
Figure 14. a v/s N of cycles for R = 0.1.
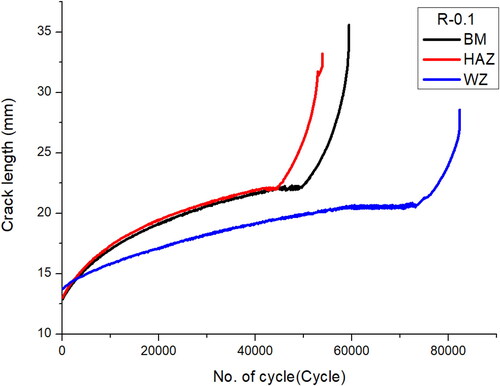
Figure 15. a v/s N for R = 0.3.
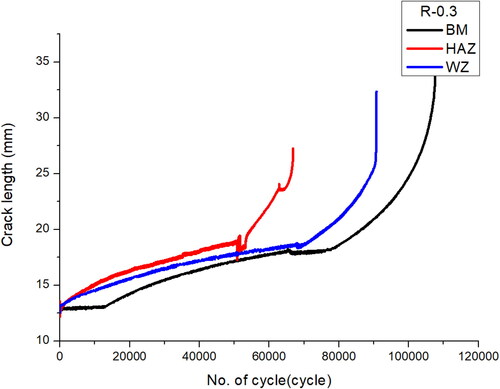
Figure 16. a v/s N for R = 0.5.
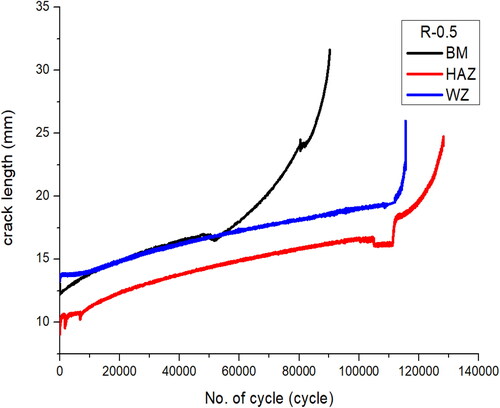
Figure 17. da/dN v/s ΔK for R = 0.1.
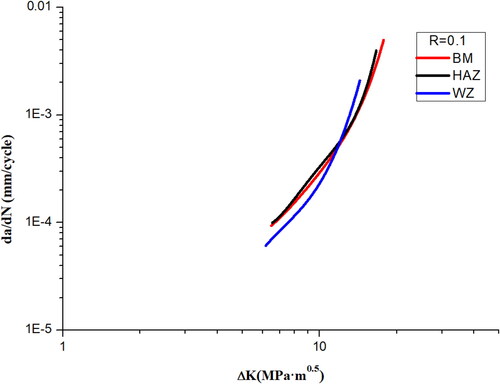
Figure 18. da/dN v/s ΔK for R = 0.3.
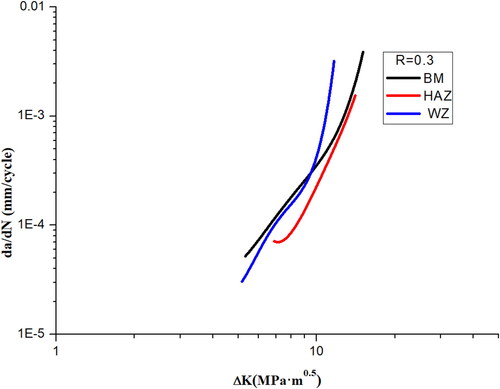
Figure 19. da/dN v/s ΔK for R = 0.5.
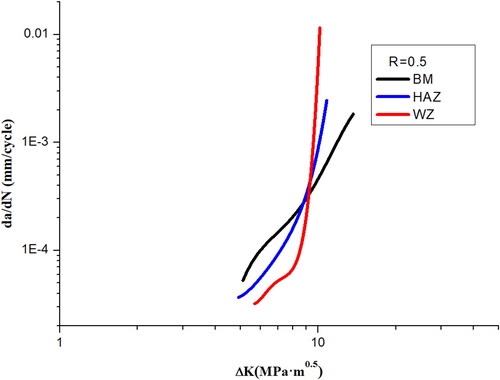
Table 7. Fitting constant obtained from experimental data.
Figure 20. Macro graph of fractured surfaces.
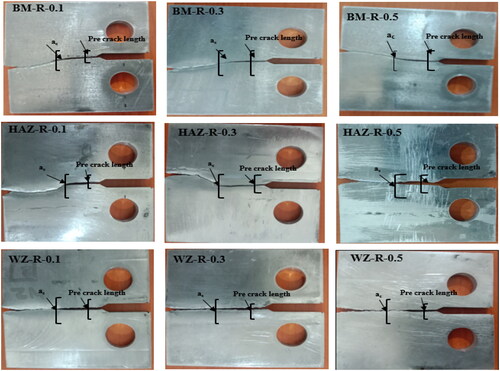
Figure 21. Micrograph of BM. (a) R = 0.1 at Kth region, (b) R = 0.1 at Kc region, (c) R = 0.3 at Kth region, (d) R = 0.3 at Kc region, (e) R = 0.5 at Kth region, (f) R = 0.5 at Kc region.
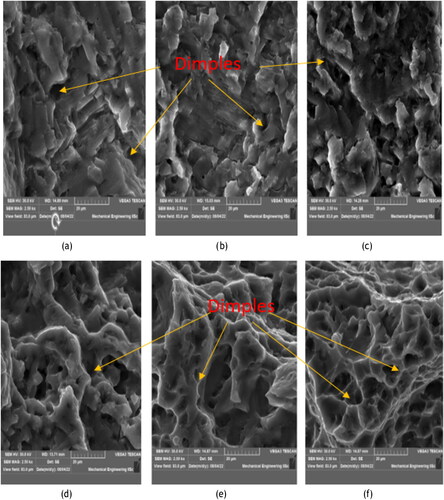
Figure 22. Micrograph of HAZ. (a) R = 0.1 at Kth region, (b) R = 0.1 at Kc region, (c) R = 0.3 at Kth region, (d) R = 0.3 at Kc region, (e) R = 0.5 at Kth region, (f) R = 0.5 at Kc region.
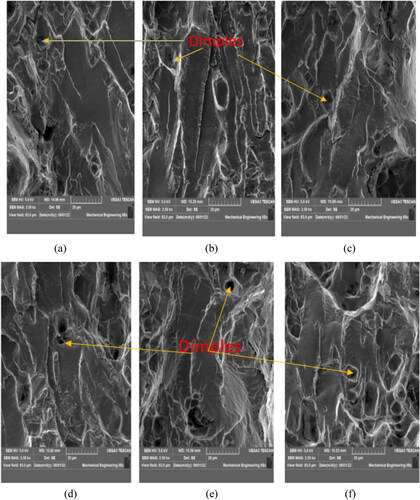
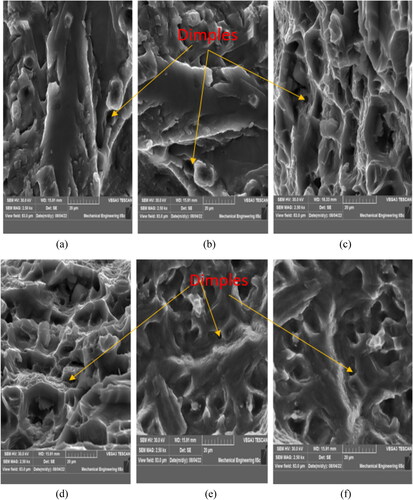
Figure 23. Micrograph of WZ. (a) R = 0.1 at Kth region, (b) R = 0.1 at Kc region, (c) R = 0.3 at Kth region, (d) R = 0.3 at Kc region, (e) R = 0.5 at Kth region, (f) R = 0.5 at Kc region.
Data availability statement
The author confirmed that the data supporting the findings of this study are within the article. Raw data supporting the findings of this study are available from the corresponding author upon reasonable request.