
Figures & data
Figure 1. The proposed VLC system block diagram.
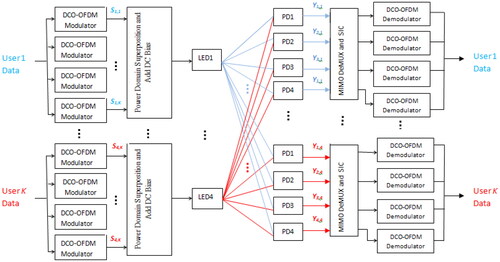
Figure 2. Geometric model of LOS transmission.
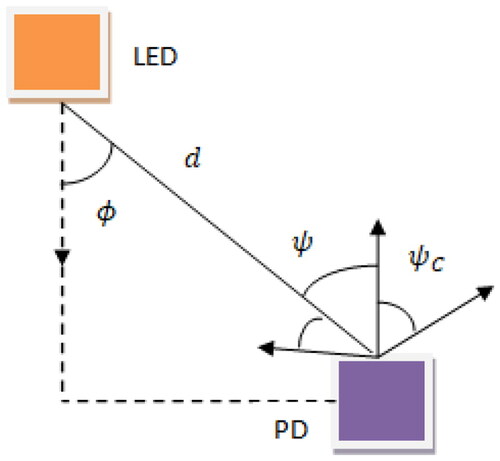
Figure 3. Illustration of a MIMO-NOMA based VLC system with K users.
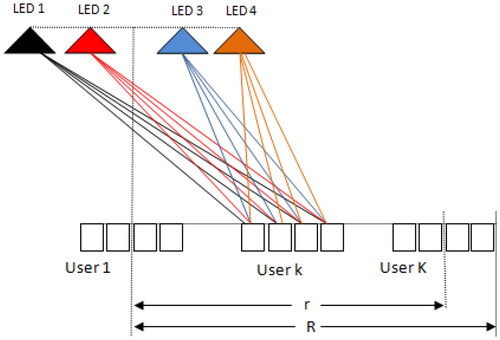
Table 1. Simulation parameters.
Figure 4. Power allocated for each user of a VLC system with five users.
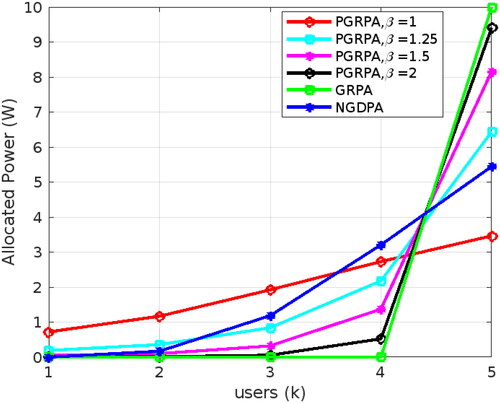
Table 2. Comparison of power allocation coefficients for five users.
Figure 5. Achievable Sum rate of Proposed NOMA, NGDPA and GRPA vs. r/R ().
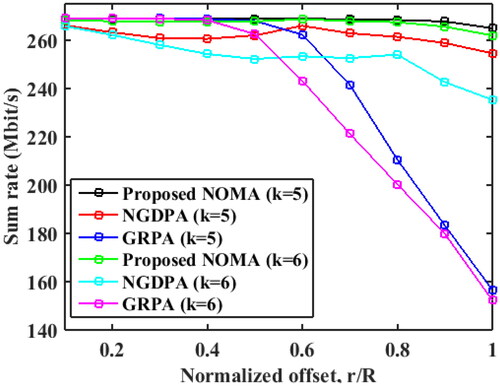
Figure 6. Achievable Sum rate of the proposed NOMA, NGDPA and GRPA vs. r/R ().
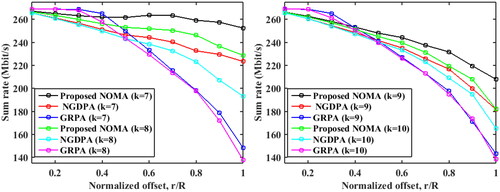
Table 3. Achievable sumrate comparison of the proposed NOMA scheme with GRPA and NGDPA for 7 and 8 users.
Table 4. Achievable sum rate comparison of proposed NOMA, NGDPA and GRPA (k = 9 and k = 10).
Table 5. Notations and its definition.
Figure 7. Achievable Average Sum Rate vs. Number of Users.
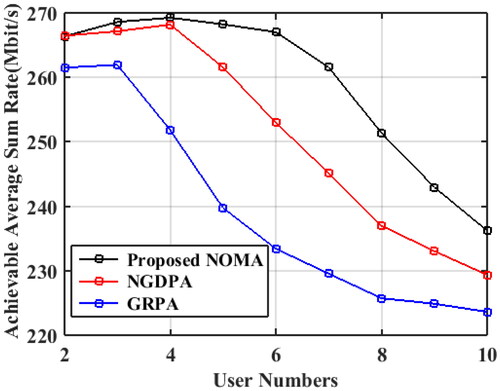
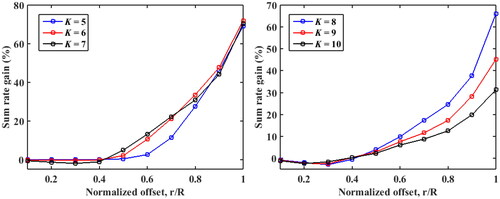
Figure 8. Sum rate gain of Proposed NOMA over NGDPA vs. Normalized offset (
), (
).
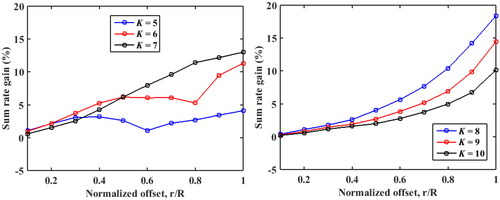
Figure 9. Sum rate gain of Proposed NOMA over GRPA vs. Normalized offset (
), (
).