Figures & data
Figure 1. Details of the RC beam specimen (units are in millimeters).
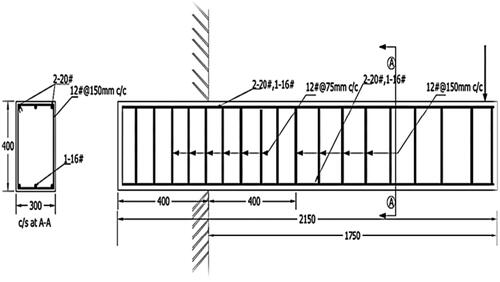
Table 1. Parameters for concrete steel model.
Figure 2. Beam model.
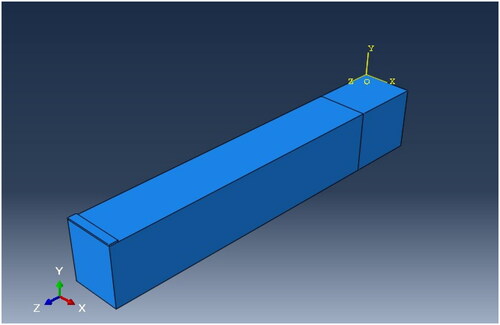
Figure 3. Model of reinforcement assembly.
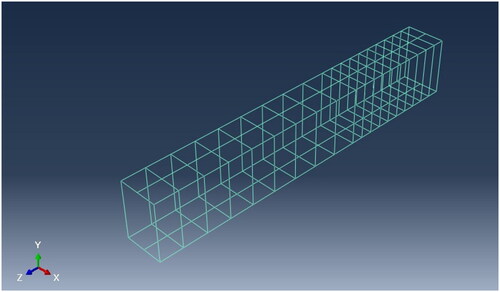
Figure 4. The validation of load-deflection curve for control beam using perfect bond model.
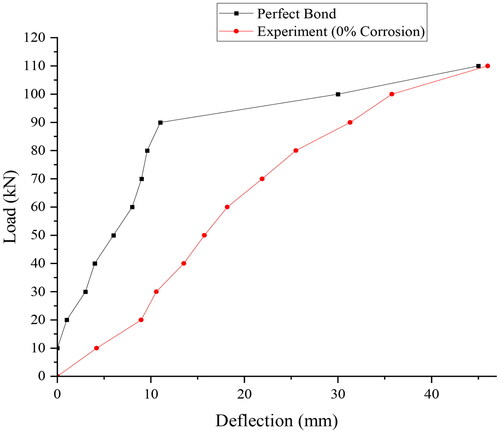
Figure 5. Influence of corrosion on concrete capacity.
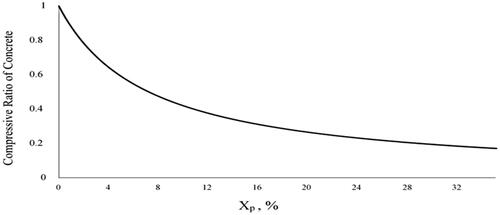
Figure 6. Bending stresses of control beam.
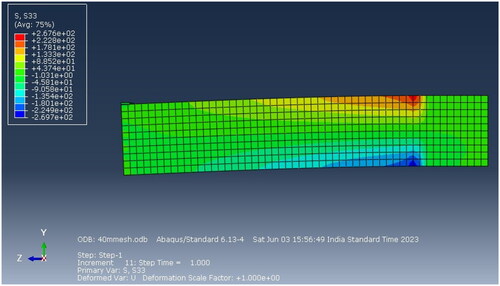
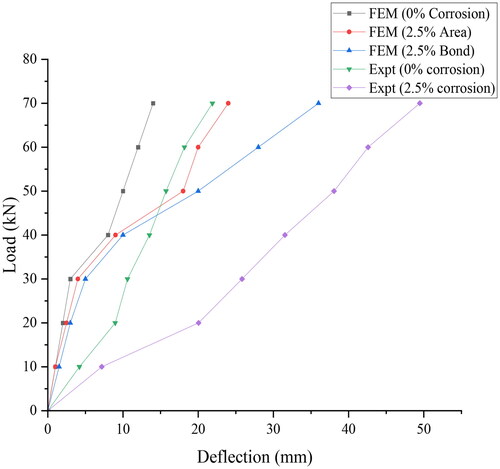
Figure 7. Validation of FE study with the experimental results for 2.5% corrosion.
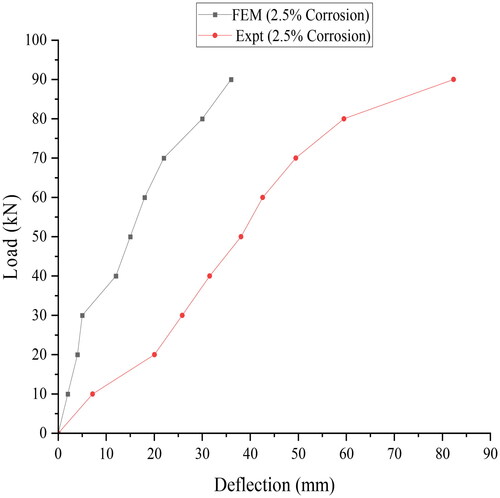
Figure 8. Validation of FE study with the experimental results for 5% corrosion.
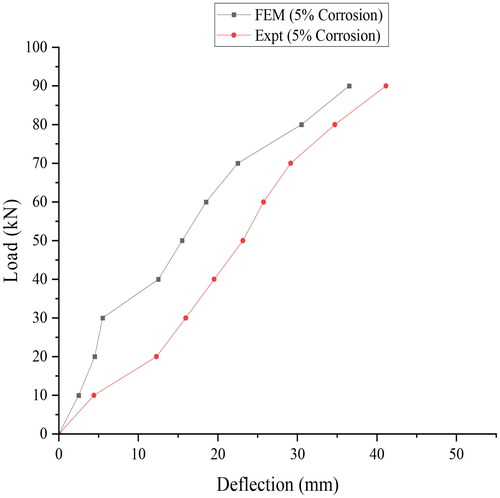
Figure 9. Validation of FE study with the experimental results for 7.5% corrosion.
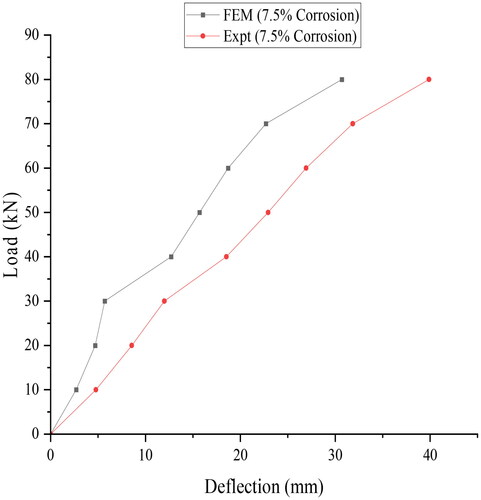
Figure 10. Validation of FE study with the experimental results for 10% corrosion.
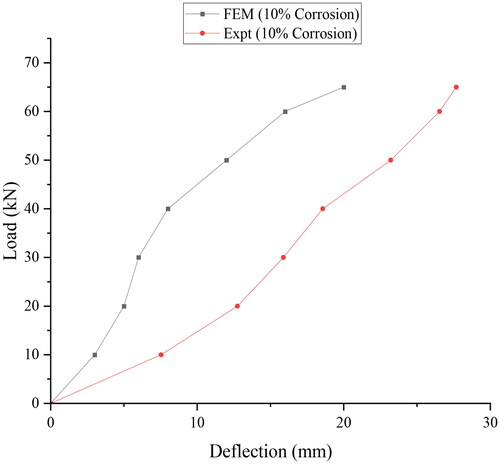
Table 2. Ultimate values for different degrees of corrosion.
Figure 11. Validation of FE study with the experimental results.
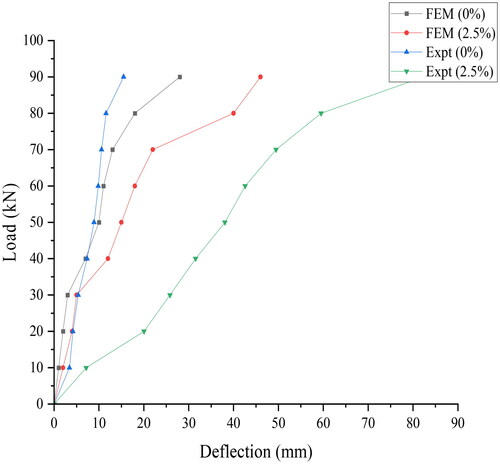
Figure 12. Validation of FE results for corroded beam.
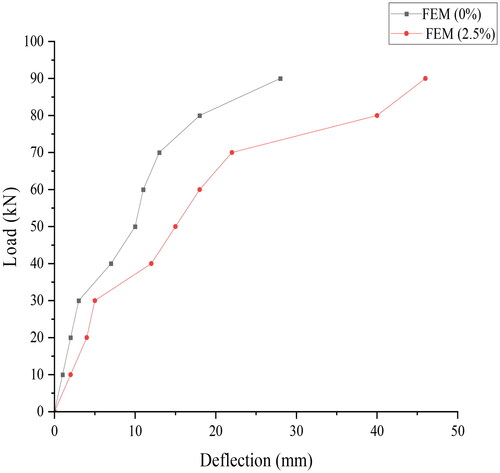
Figure 13. Deflection of reinforcement assembly at 10% corrosion.
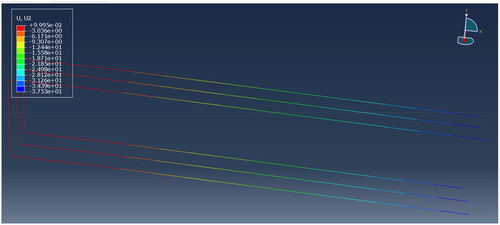
Figure 14. Bond strength of beams for various compressive strength of concrete.
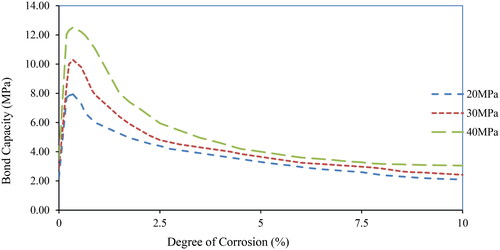
Figure 15. Influence over FE results of RC beam on varying mesh sizes.
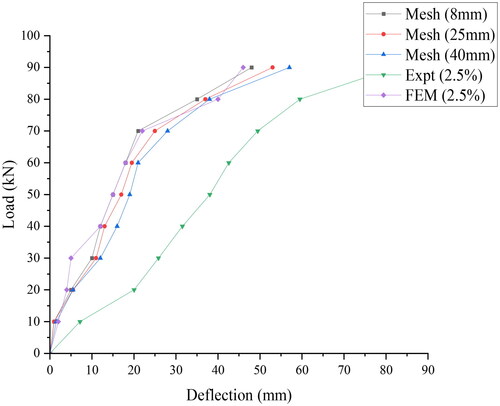
Figure 16. 25 mm mesh deformation.
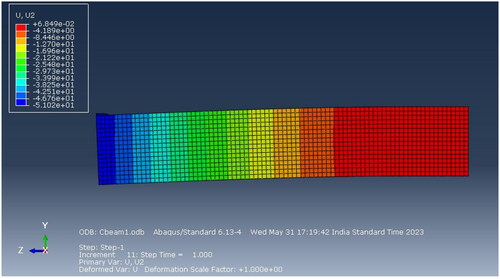
Figure 17. 40 mm mesh deformation.
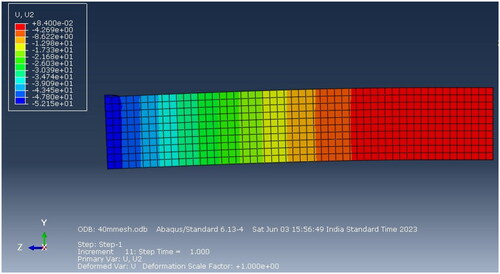
Figure 18. Influence of varied mesh size for both concrete and rebars in FE models.
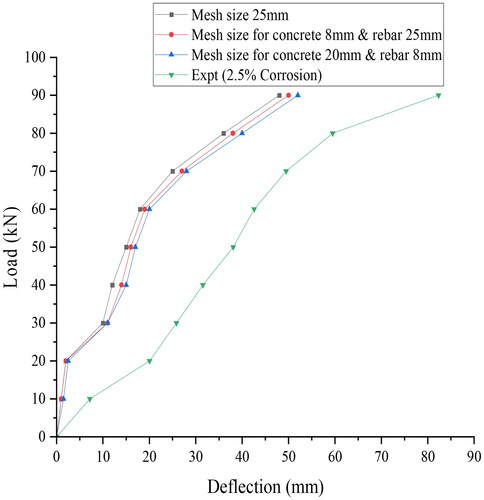
Figure 19. Model of exponential decay in friction (Abaqus CAE Manual A, Citation2013).
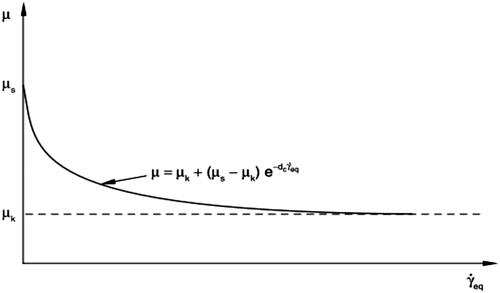
Table 3. Parameters used for analytical model.
Figure 20. 25 mm mesh steel cage deformation.
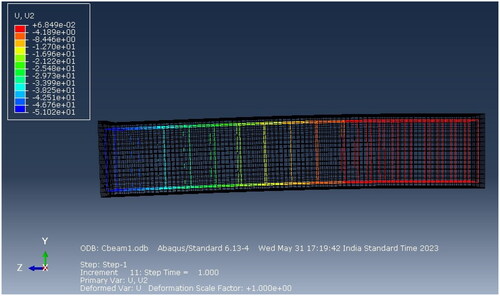
Figure 21. Crack propagation.
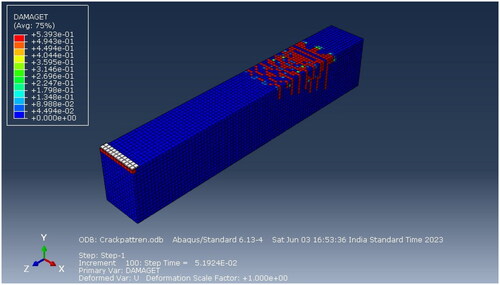
Figure 22. Plot of load versus deflection for various damages due to corrosion in RC beams.