
Figures & data
Figure 1. RBFNN configuration.
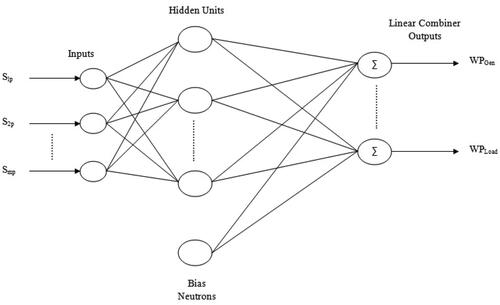
Figure 2. Block diagram of research methodology.
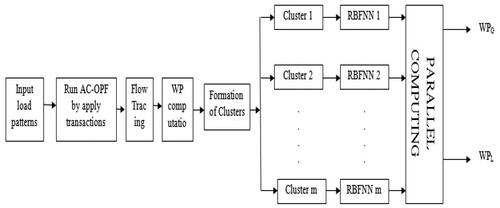
Table 1. Clustering details for generators in IEEE-30 bus system.
Figure 3. Testing performance of ANN in IEEE-30 bus system (cluster 1).
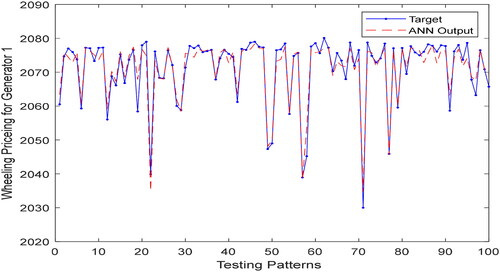
Table 2. Wheeling Price prediction for Generators in IEEE-30 bus system (cluster 1).
Figure 4. Testing performance of ANN in IEEE-30 bus system (cluster 2).
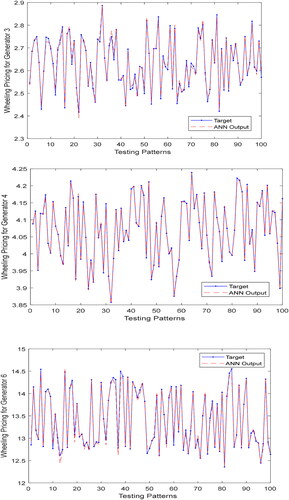
Table 3. Wheeling price prediction for generators in IEEE-30 bus system (cluster 2).
Figure 5. Testing performance of ANN in IEEE-30 bus system (cluster 3).
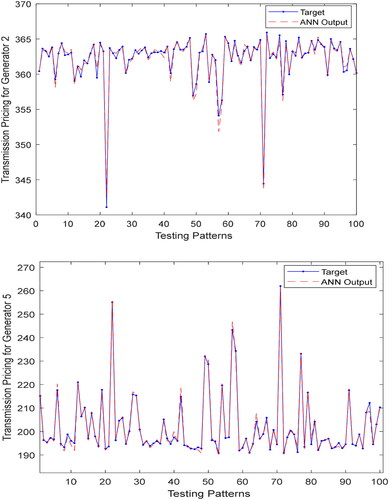
Table 4. Wheeling price prediction for generators in IEEE-30 bus system (cluster 3).
Table 4. Summary of wheeling price prediction for generators.
Table 5. Clustering details for wheeling pricing of loads in IEEE-30 bus system.
Figure 6. Testing performance of ANN in IEEE-30 bus system (cluster 4).
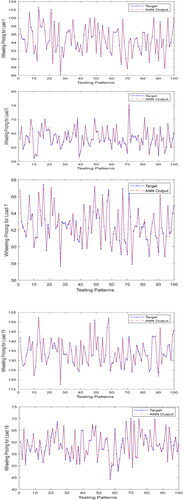
Table 6. Wheeling price prediction for loads in IEEE-30 bus system (cluster 4).
Figure 7. Testing performance of ANN in IEEE-30 bus system (cluster 5).
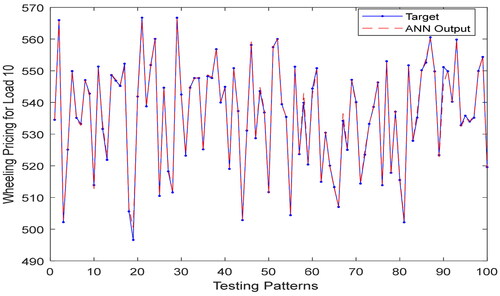
Table 7. Wheeling price prediction for loads in IEEE-30 bus system (cluster 5).
Figure 8. Testing performance of ANN in IEEE-30 bus system (cluster 6).
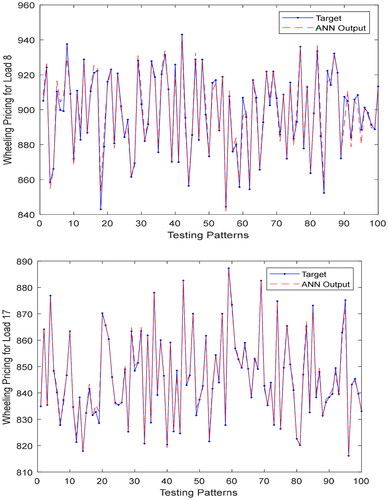
Table 8. Wheeling price prediction for loads in IEEE-30 bus system (cluster 6).
Figure 9. Testing performance of ANN in IEEE-30 bus system (cluster 7).
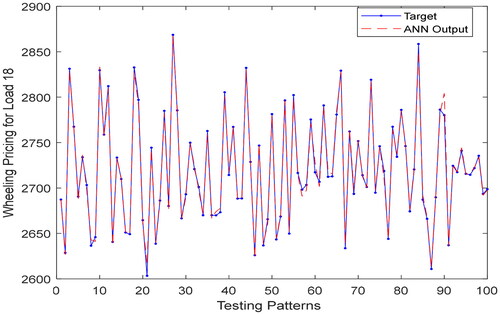
Table 9. Wheeling price prediction for loads in IEEE-30 bus system (cluster 7).
Figure 10. Testing performance of ANN in IEEE-30 bus system (cluster 8).
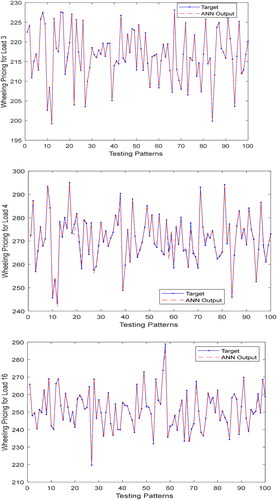
Table 10. Wheeling price prediction for loads in IEEE-30 bus system (cluster 8).
Figure 11. Testing performance of ANN in IEEE-30 bus system (cluster 9).
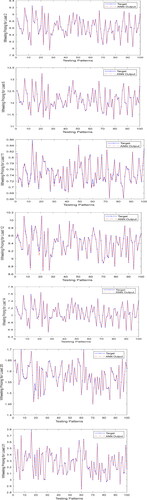
Table 11. Wheeling price prediction for loads in IEEE-30 bus system (cluster 9).
Figure 12. Testing performance of ANN in IEEE-30 bus system (cluster 10).
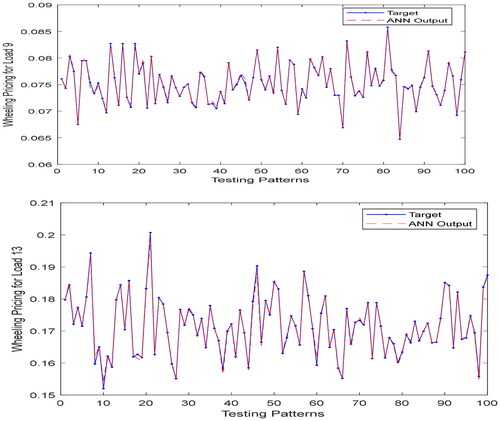
Table 12. Wheeling price prediction for loads in IEEE-30 bus system (cluster 10).
Table 13. Parallel computing details for wheeling pricing in IEEE 30-bus system.