Figures & data
Figure 1. 3D geometric models of the (a) reactor and (b) tank.
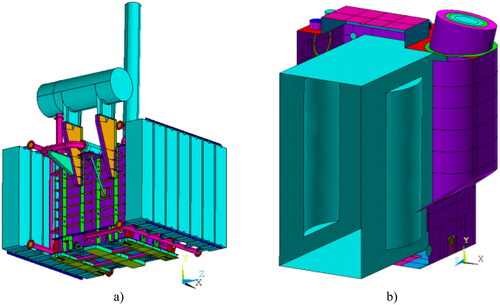
Table 1. Main technical data related to POM-60000/525-У1.
Figure 2. (a) Dimensional parameters of the magnetic circuit and (b) 3D model of the reactor.
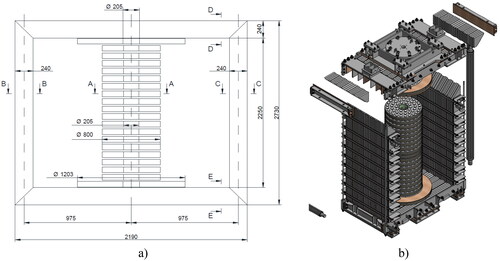
Table 2. Design sound pressure and power.
Table 3. Design characteristics and dimensions of the POM-60000/525-U1 reactor.
Figure 3. Saturation curve of the core material.
Figure 4. Installation of rubber gaskets on the 3D model of the reactor: (a) 1—between the packages of the magnetic system and (b) 2—between the beam and the yoke on the assembled reactor.
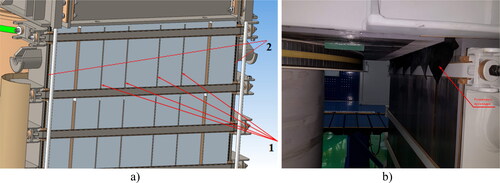
Figure 5. Grounding scheme of the magnetic system stacks.
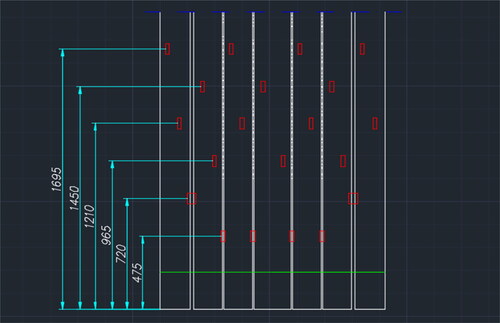
Figure 6. Points at which the sound levels of the reactor are measured: A—high-voltage lead and X1, X2—grounded side.
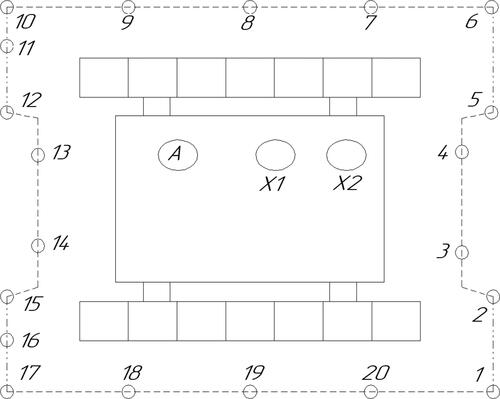
Figure 7. Process of measuring the sound levels of the РОМ-60000/525-У1 reactor.
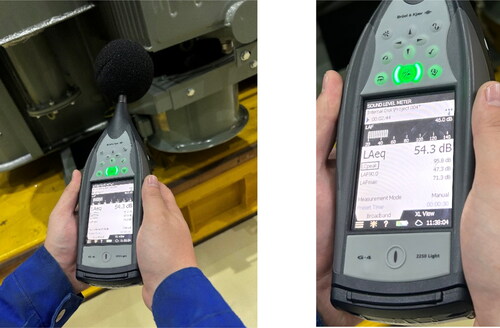
Table 4. Measured extraneous noise levels.
Table 5. Measured sound levels.
Table 6. Comparison between the calculated noise characteristics of РОМ-60000/525-У1 and those of РОМБСМ-60000/500-У1.
Figure 8. Process of measuring vibration displacements of the tank wall and the cooling system of РOM-60000/525-У1.
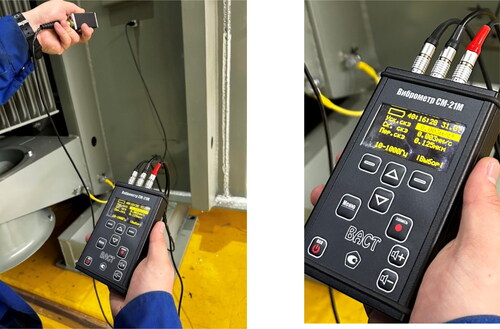
Figure 9. Points at which vibration displacements are measured on the tank wall (1–12) and the reactor cooling system (1–14).
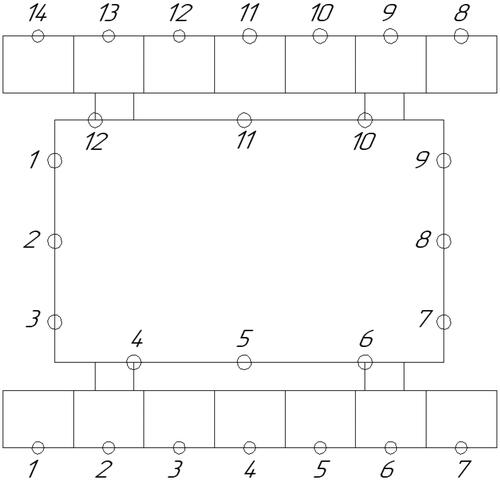
Table 7. Measured vibration displacements of the tank wall.
Table 8. Measured vibration displacements on the cooling system.
Figure 10. Vibration displacements (mm) of the tank walls at 100 Hz. (a) Calculation results and (b) 3D model of the tank.
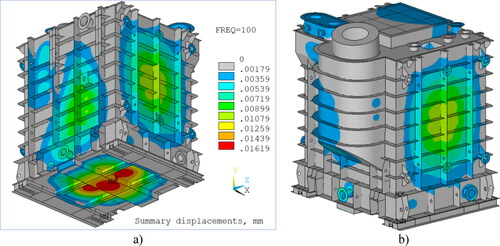
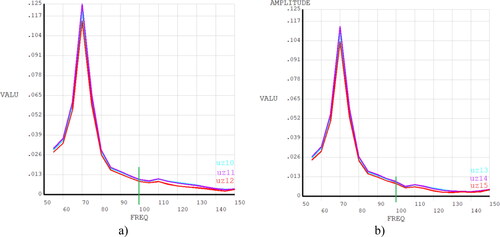
Figure 11. Vibration displacements of the tank at a frequency of 100 Hz (mm) on the HV (‘−Z’) side. (a) Calculation results and (b) location of selected points 10–15.
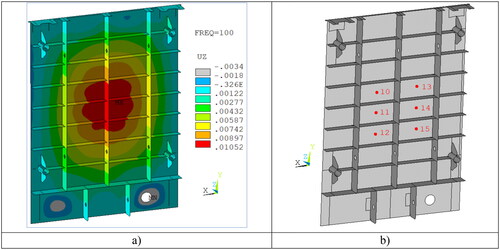
Figure 12. Displacement plots (mm) in the frequency range of 50–150 Hz were obtained from (a) points 10–12 and (b) 13–15 along the z-axis.