
Figures & data
Table 1. Description of the types of wastes in manufacturing processes (Obeidat et al., Citation2012; Ohno, Citation1988; Rahmanasari et al., Citation2021; Wu, Citation2003).
Table 2. Purpose and category of some lean tools implemented in manufacturing industries.
Table 3. Review of applications of VSM in the textile and apparel industry.
Figure 1. Research framework.
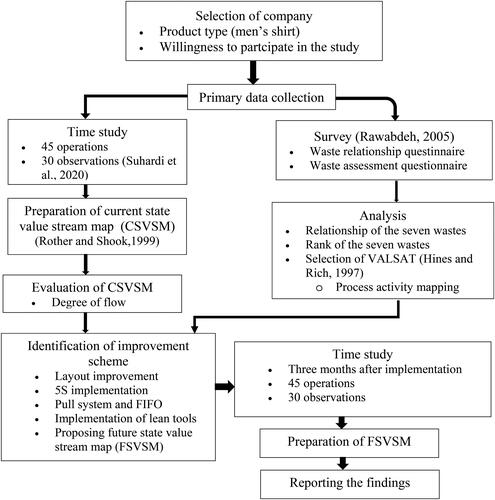
Table 4. Groups of waste assessment questions by type of waste.
Table 5. An algorithm for computing the ranks of the seven wastes (Rawabdeh, Citation2005).
Table 6. Waste relationship matrix.
Table 7. Sample analysis of the responses to the waste assessment questionnaire.
Table 8. Summary of lean waste assessment and the rank of the seven lean wastes.
Figure 2. Current state value stream map of a shirt manufacturing process.
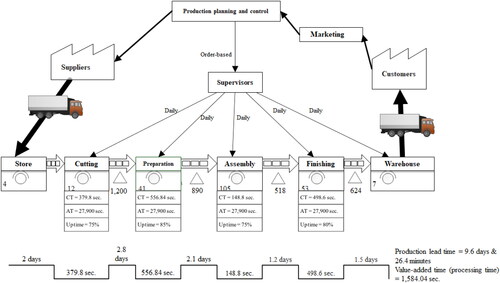
Figure 3. Future state value stream map of a shirt manufacturing process.
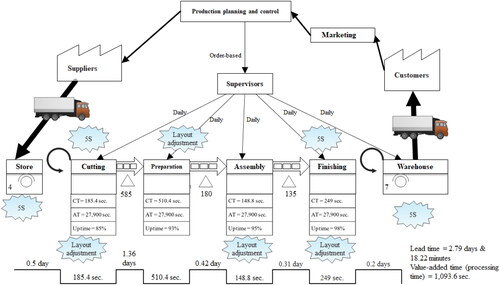
Figure 4. WIP inventory of shirt manufacturing processes.
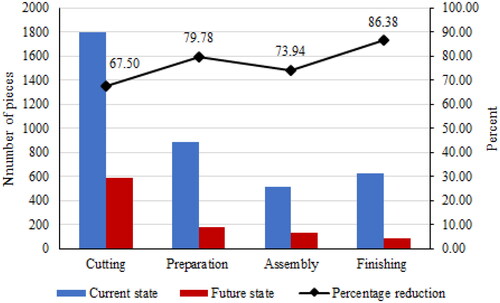
Figure 5. Value-added time and production lead time of shirt manufacturing.
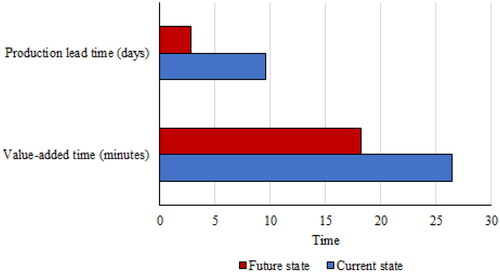
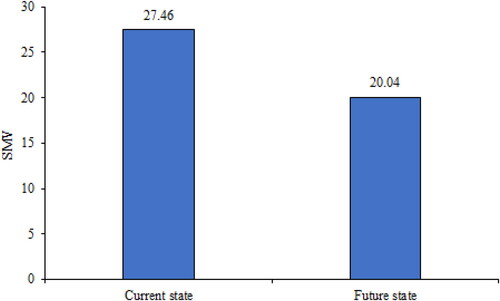
Figure 6. SMV of shirt manufacturing.
Appendix B. Waste assessment questionnaire customised from Rawabdeh (Citation2005) (Y = yes = 1, M = medium = 0.5, and N = no = 0)