
Figures & data
Figure 1. (a–d) Water contact angle (WCA) and time for water droplets to linger on the surface of the modified and unmodified PF sorbents and (e and f) water contact angle (WCA) and time for the water droplets to linger on the surface of the SF and its modified form showing the optimization of the chemicals used in the modification process. 4 mg/mL (2) of GO (G) and 400 mg (4) of stearic acid (SA), and 100 mg (1) of TiO2 (T) were used.
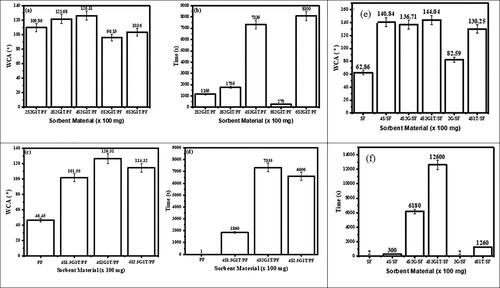
Figure 2. (a). Uptake/absorption capacities of the SF and PF modified and unmodified sorbents for some oils (b) uptake capacity/absorption capacity of the unmodified and modified SF sorbents in a crude oil/seawater environment, (c and d) recyclability of the modified PF and SF sorbents respectively for 5 cycles making use of crude oil.
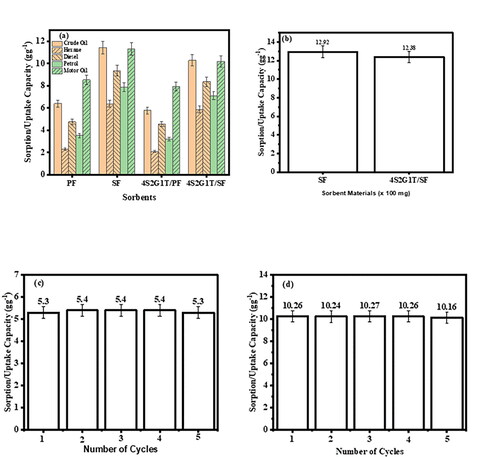
Figure 3. Schematic diagram of the sorption mechanism of the bagged sorbents (a) at the initial stage and (b) at the final stage.
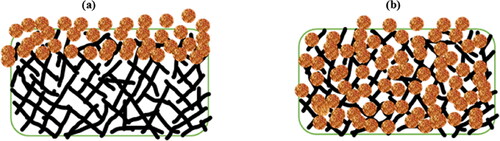
Figure 4. Microscopic images of (a) packed fibers in the tea bag, (b) the surface of the unmodified bagged sorbent (c) the surface of the modified bagged sorbent, (d) the modified fibers’ interaction with crude oil, (e) unmodified sorbent interaction with water and (f) modified sorbent’s interaction with crude oil.
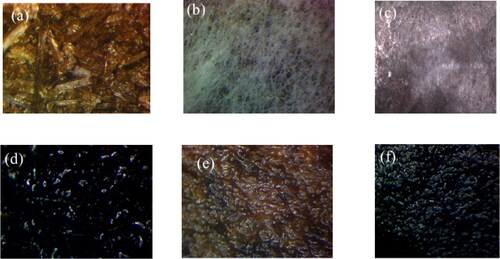
Figure 5. (a–d) SEM-EDS of unmodified and modified surfaces of the bagged sorbent material respectively, (e–h) SEM-EDS of unmodified and modified surfaces of the plantain pseudo-stem fiber respectively, and (i–l) SEM-EDS of the unmodified and modified surfaces of the sugar cane fibers respectively.
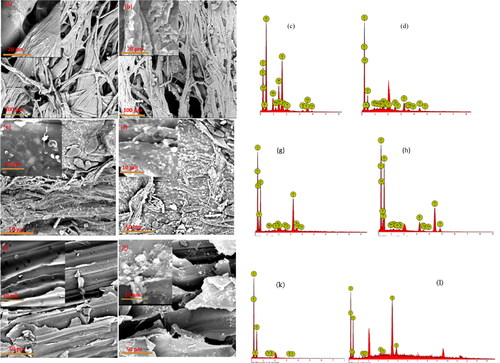
Figure 6. (a and b) Microscopy images of unmodified and modified surfaces of the sorbent material respectively.
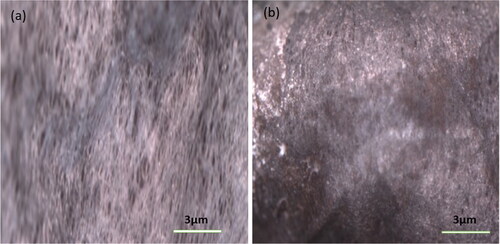
Figure 7. (a–d) Photographic images of the water droplets on the surfaces of the unmodified SF, modified SF, unmodified PF, and unmodified PF sorbent materials respectively, and (e–h) Photographic images of crude oil droplets on the surfaces of the unmodified SF, modified SF, unmodified PF, and unmodified PF sorbent materials respectively.
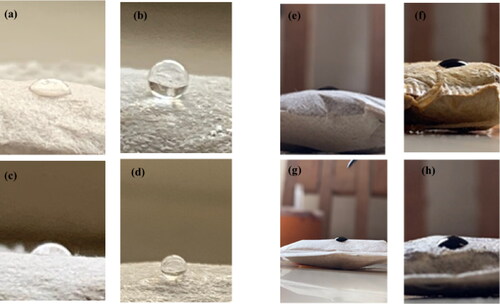
Figure 8. (a–f). Water Contact Angle (WCA) and time for water droplets to linger on the surface of the modified and unmodified SF sorbents using varying amounts of SA (S), GO (G), and TiO2 (T) in the surface modification.
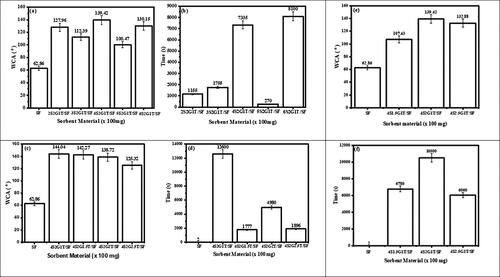
Figure 9. a–c. FTIR of a. unmodified and modified surfaces of the bagged PF and SF sorbent materials, b. the unmodified and modified PF and SF fibers in the bagged sorbent materials and c. SA, TiO2 and GO.
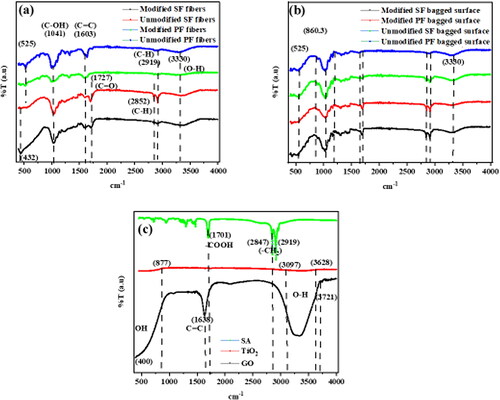
Table 1. Chemical Composition of the SF and PF.
Figure 10. (a) TGA and (b) thermographic analysis for derivatives of mass min−1 versus temperature for the tea bag, plantain pseudo-stem fiber (PF), sugar cane fiber (SF), unmodified SF and PF sorbents (UMSF and UMPF, respectively), and modified SF and PF sorbents (MSF and MPF, respectively).
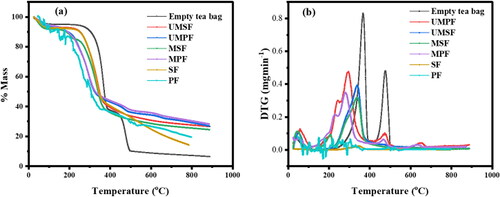
Table 2. Parameters used in the calculation of the tensile properties of the unmodified and modified tea bag.
Table 3. Tensile properties of the unmodified and modified tea bag.
Table 4. Static contact angles of crude oil at 1 s on the unmodified and modified sorbent surfaces.
Figure 11. (a and b) Photographic images of the PF and SF sorbents, respectively, after 5 cycles with water droplets on the surface to analyze their hydrophobic state.
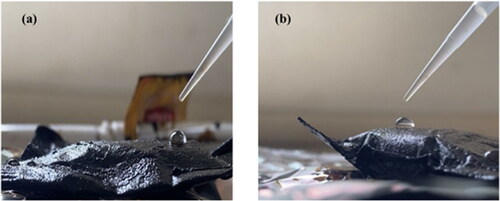
Table 5. Absorption/sorption capacities of different natural sorbents.
Data availability statement
The datasets generated during and/or analyzed during the current study are available from the corresponding authors upon reasonable request.