Figures & data
Figure 1. Process flow diagram of proposed handwritten character recognition.
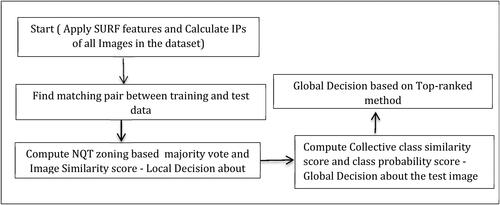
Figure 2. (a). Matching pair formation between the IPs of D11 and Z. Solid line indicates the best match with minimum distance between IPs. (b): Best matches between IPs of D11 and Z.
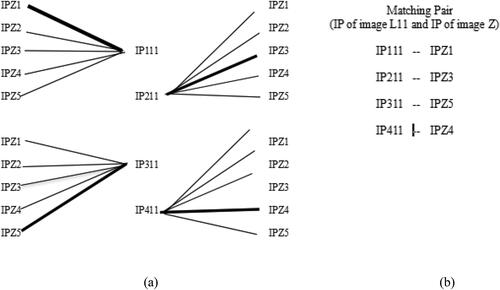
Table 1. The proposed NQT vote and image similarity score computation to determine the class of Z from the Tamil Handwritten character database.
Table 2. Determination of the class of Z based on global decision. Z is classified to the class D2.
Table 3. Comparison of the average classification accuracy of Tamil vowels between the proposed method and existing transfer learning models.
Table 4. Comparison of the average classification accuracy of Hindi vowels between the proposed method and existing transfer learning models.
Table 5. Comparison of the average classification accuracy of Tamil vowels between the proposed method and existing transfer learning models.
Figure 3. Equal partitioning vs. quad-tree partitioning. (a) Sample image Ah (b) Equal partitioning with depth 1 (c) Equal partitioning with depth 2. (d) CG-based quad-tree partitioning with depth 1 (e) CG-based quad-tree partitioning with depth 2.
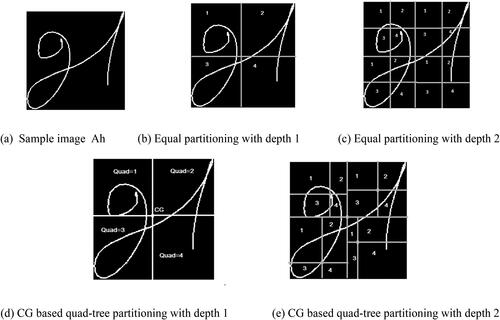
Figure 4. Intra-class images displaying incorrect matching are depicted in Figure (a). In this scenario, insertion points (IPs) from the first and third quadrants of the initial image ‘la’ erroneously pair with the second quadrant of the second image ‘ja’. These pairings result in nas vote = 1. Figure (b) illustrates another instance where three IPs from quadrant 2 of the training image ‘aah’ mistakenly match with IPs of the letter ‘uh’ in quadrant 1. Moreover, an IP from quadrant 2 and another from quadrant 4 of ‘aah’ erroneously pair with quadrant 3 of image ‘uh,’ also yielding nas vote = 1. Moving to Figure (c), we examine inter-class Tamil characters ‘na’ and ‘nna’ for comparison. Despite the majority of lines connecting IPs falling within the upper and lower boundaries of the na threshold, there are a few exceptions. Notably, the misclassification of IPs in all three cases generates angles within the upper and lower bounds of the na classifier, resulting in positive votes vi = 1. However, by considering the quadrants in which the IPs of the matching pair are present, we can rectify these misclassifications.
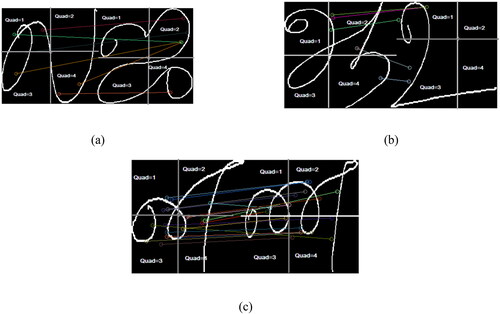
Figure 5. Two inter-class Tamil character images of class ‘Ah’ having most of the IPs in the matching pairs in the same quadrants.
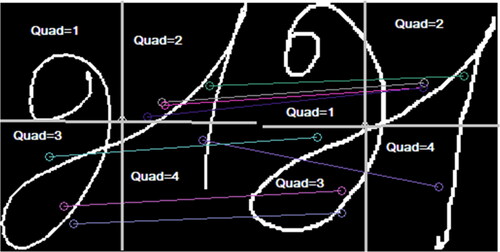
Table 6. Misclassification results of Tamil vowels with vowels-consonants using various classifiers.
Figure 6. Two intra-class images of Tamil character ‘Ah’ with most of the IPs are inside the same quadrants of respective images showing highest similarity.
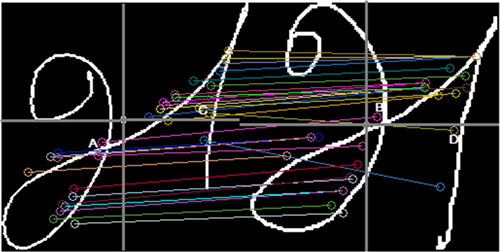
Figure 7. (a) Proposed model training vs. testing accuracy for Tamil dataset. (b) Proposed model training vs. testing loss for Tamil dataset. (c) Proposed model training vs. testing accuracy for Telugu dataset. (d) Proposed model training vs. testing accuracy for Telugu dataset. (e) Proposed model training vs. testing accuracy for Devanagari dataset. (f) Proposed model training vs. testing accuracy for Devanagari dataset.
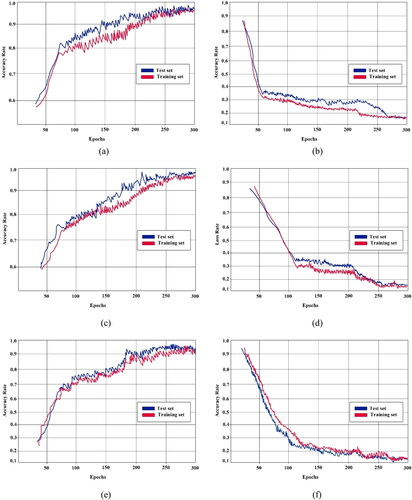
Figure 8. Training time analysis for proposed method with existing transfer learning models.
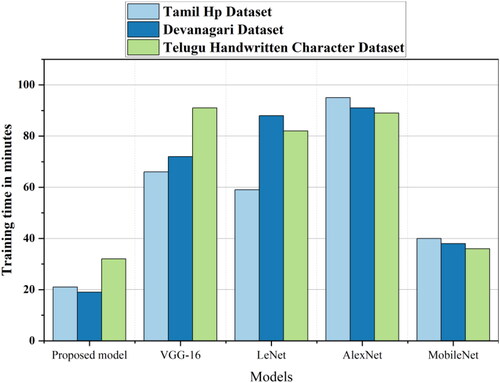
Figure 9. CPU Utilization Comparison for proposed method with existing transfer learning models.
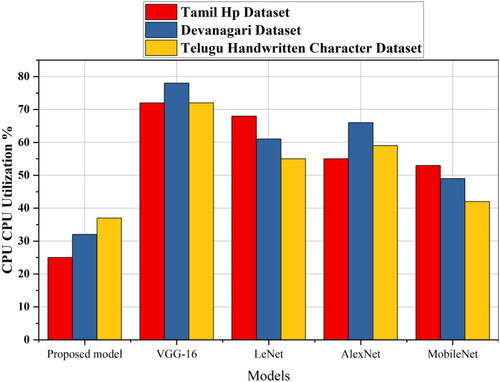
Figure 10. GPU utilization comparison for proposed method with existing transfer learning models.
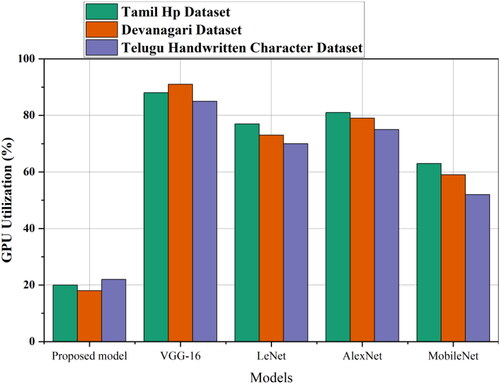
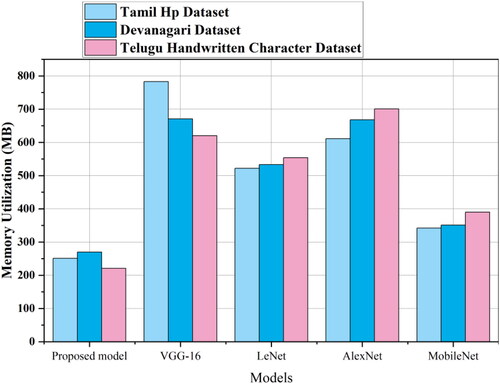
Figure 11. Memory utilization comparison for proposed method with existing transfer learning models.