
Figures & data
Figure 1. The locations of the areas where fine aggregate samples were collected are denoted by red spots.
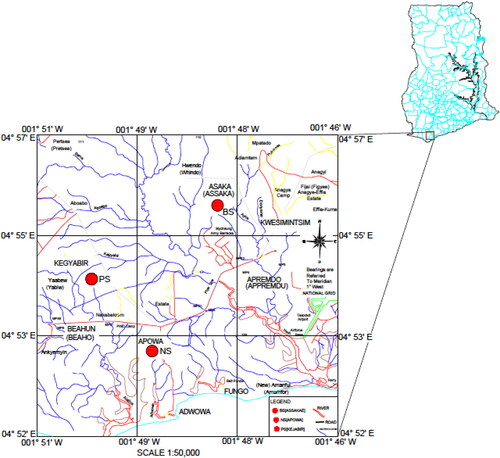
Figure 2. Flowchart illustrating the work process of the study.
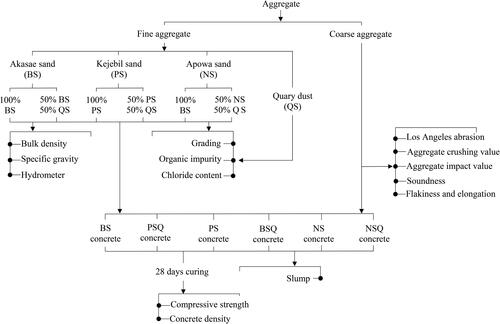
Table 1. Mix design of concrete.
Figure 3. The Los Angeles Abrasion test machine.
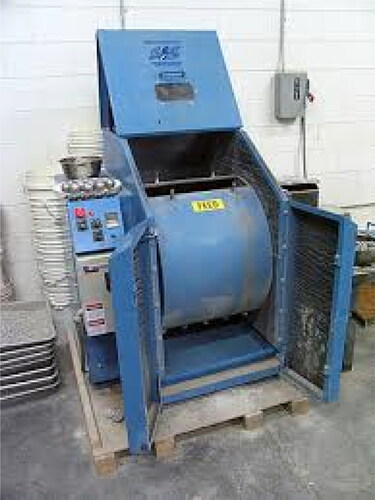
Figure 4. The slump test. (a) The cone was used for the test. (b) The slump was produced from a cone with a rod and measuring ruler measuring the slump in millimetres.
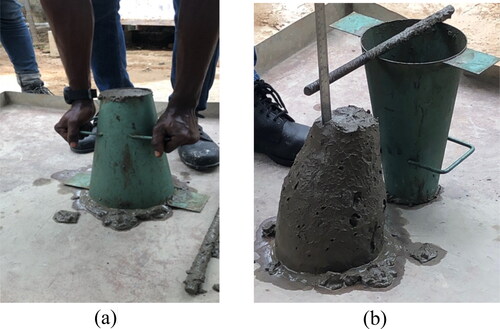
Table 2. Chemical composition of fine aggregates.
Figure 5. The chloride content of fine aggregates.
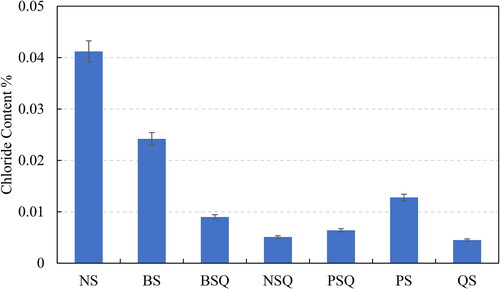
Table 3. Chloride and oxygen contents of fine aggregates.
Table 4. Physical properties of coarse aggregates.
Figure 6. Particle distribution of fine aggregates.
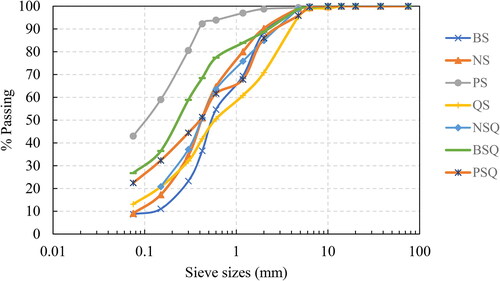
Table 5. Physical properties of fine aggregates.
Figure 7. Slump of concrete mix.
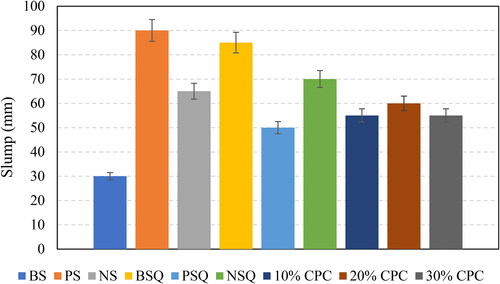
Figure 8. Average density vs. days of curing.
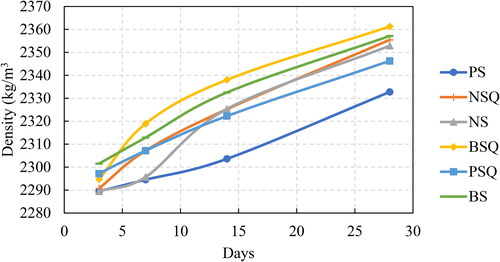
Figure 9. Development of density and compressive strength during curing.
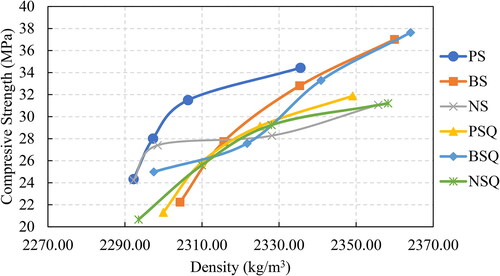
Figure 10. Average density and compressive strength vs days of curing.
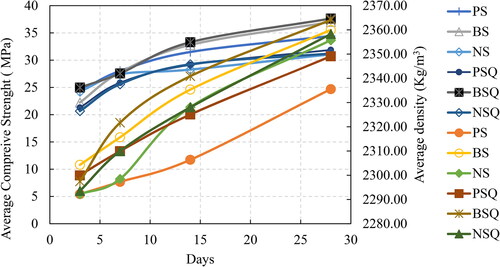
Table 6. The average density of concrete produced with different fine aggregates.
Figure 11. Relationship between the curing ages and the compressive strength.
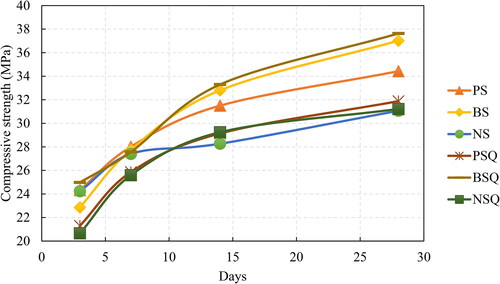
Table 7. Average compressive strength for all types of fine aggregates.
Data availability statement
The data and materials supporting the results or analyses presented in this article are available upon reasonable request. Requests for access to the data should be directed to the corresponding author.