Figures & data
Figure A1. Bias correction approach applied in the CMhyd software.
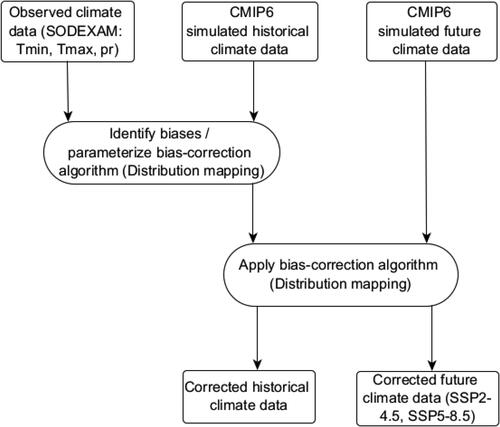
Figure A2. Comparison of raw and bias-corrected precipitation ensemble with respect to observed data.
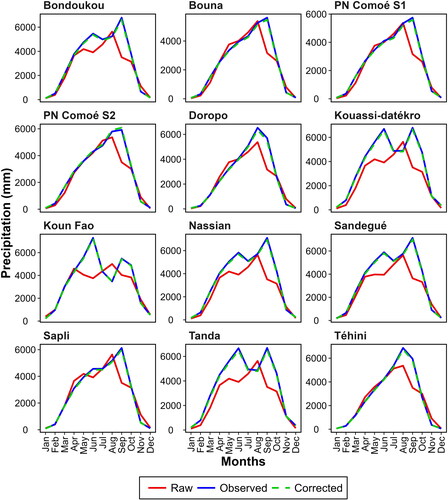
Figure A3. Comparison of raw and bias-corrected Tmax ensemble with respect to observed data.
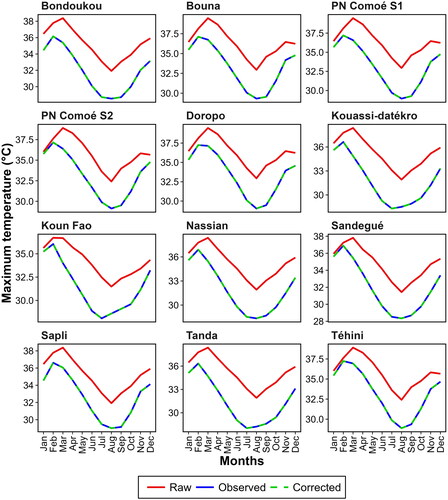
Figure A4. Temporal variability in annual mean Tmin between 1981 and 2100 for the SSP2-4.5 and SSP5-8.5 scenarios.
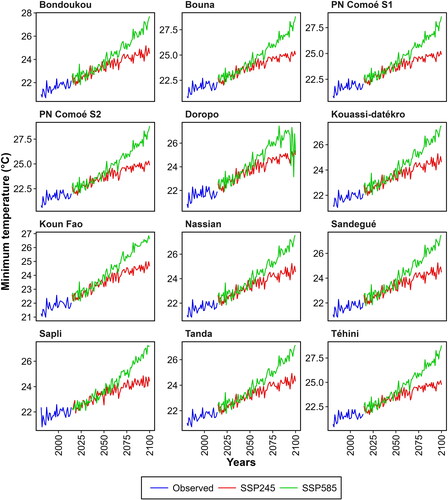
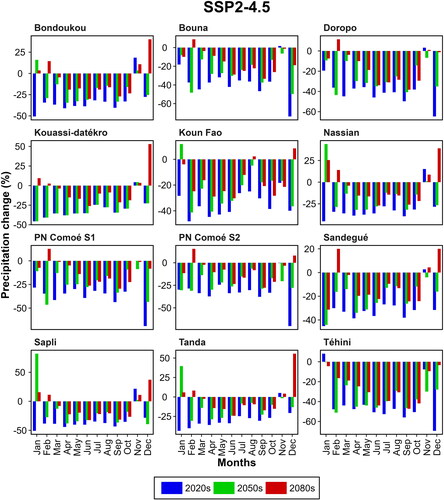
Figure A5. Mean monthly change of precipitation (%) for the periods 2020s (2011-2040), 2050s (2041-2070), and 2080s (2071-2100) relative to 1981-2010 for the ground stations under SSP2-4.5.