
Figures & data
Table 1. Lean tools (definitions and objectives obtained from previous studies).
Figure 1. Study area map.
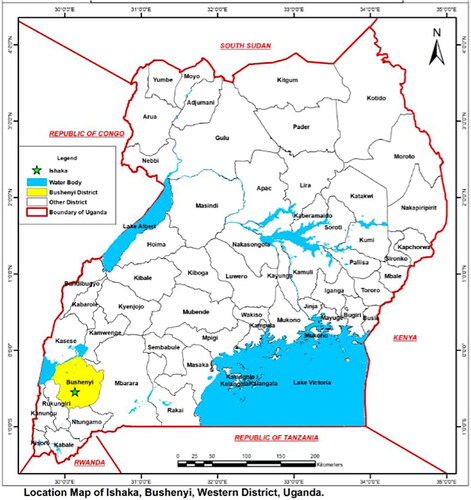
Table 2. Demography of respondents.
Table 3. Respondents feedback to examine most significant trends in lean construction practices.
Table 4. Respondents feedback to assess effective lean construction principles.
Table 5. Respondents feedback to examine lean construction implementation challenges.
Table 6. Respondents feedback to investigate lean construction impact on project delivery.
Figure 2. Spearman correlation matrix plot for lean current construction practices assessment.
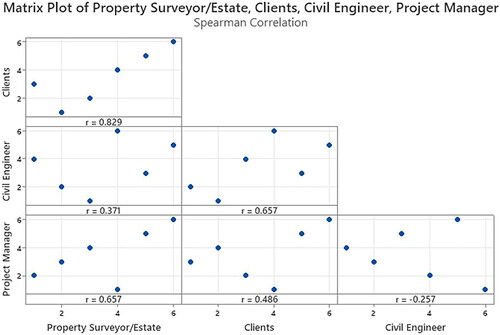
Table 7. Pairwise Spearman correlations for lean current construction practices assessment.
Figure 3. Spearman correlation matrix plot for examination of effective Lean construction principles.
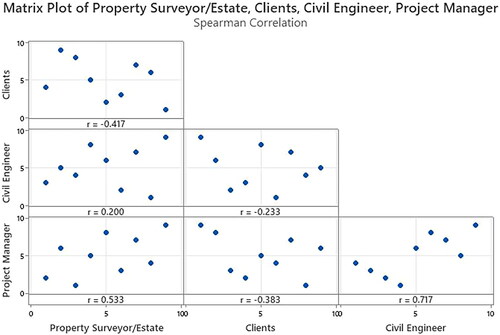
Table 8. Pairwise Spearman correlations for examination of effective lean construction principles.
Figure 4. Spearman correlation matrix plot for evaluation of lean construction implementation challenges.
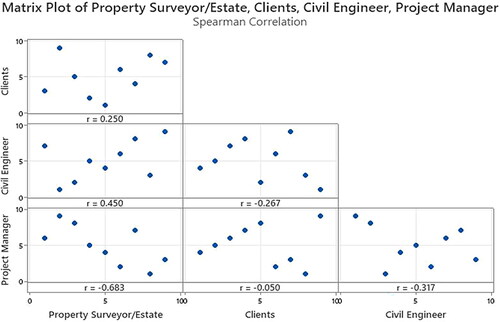
Table 9. Pairwise Spearman correlations for evaluation of lean construction implementation challenges.
Figure 5. Spearman correlation matrix plot for evaluation of lean construction practices impact on project delivery.
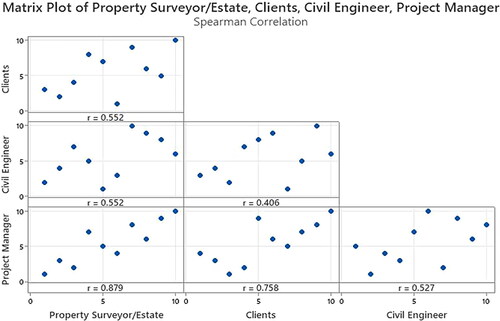
Table 10. Pairwise Spearman correlations for evaluation of lean construction practices impact on project delivery.
Data availability statement
The datasets generated and analyzed during this study are available from the corresponding author on reasonable request.