
Figures & data
Figure 1b. Integmac User Interface Snapshots of Remedial Actions. (c) Integmac Snapshot of Computed Integrity.
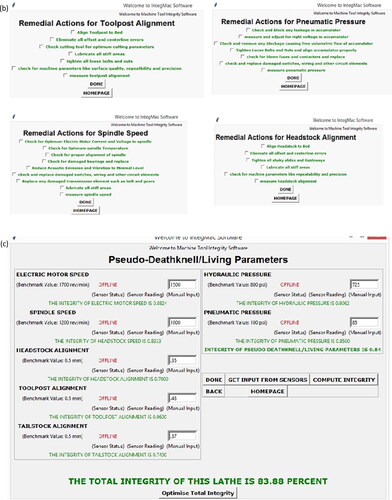
Figure 1a. Flowchart of the Model of the Mechatronic System.
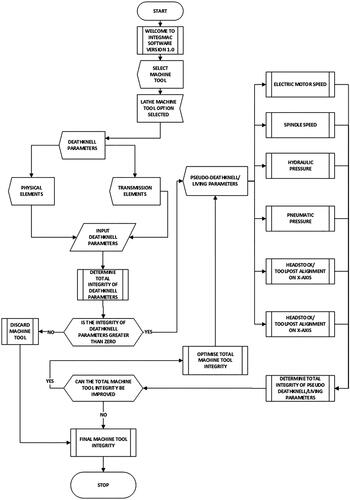
Figure 2. Structure of the Mechatronic System.
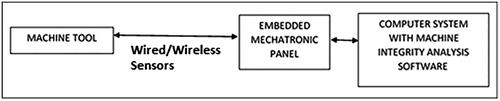
Table 1. Comparison between machine tools.
Table 2. Probe locations and measurement.
Figure 3(a). LDR Circuit Diagram, (b) Direct connection of LDR to the Arduino Board, (c) LDR Grid with a multiplexer and Jumper cables.
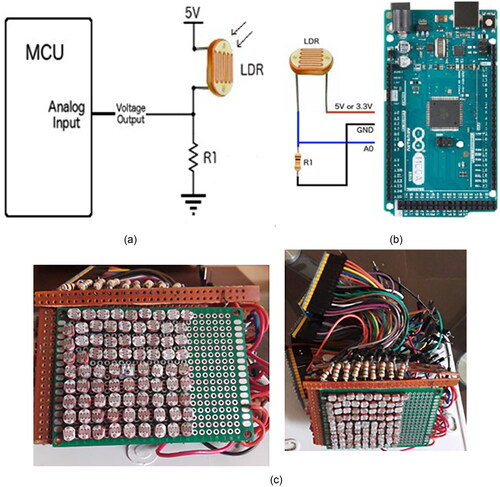
Figure 4. The alignment module is mounted onto the headstock, and the laser beam points towards the tailings stock.
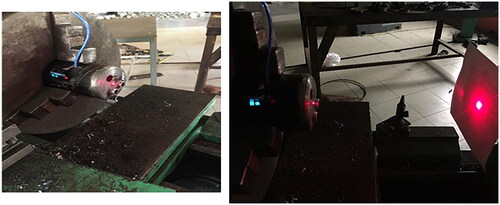
Figure 5. Mechatronic Circuitry.
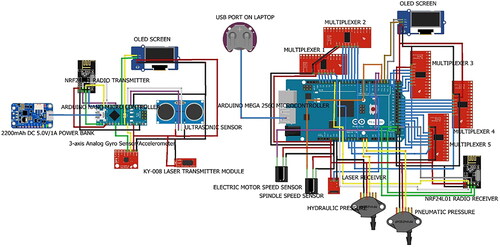
Figure 6. Mechatronic System Architecture.
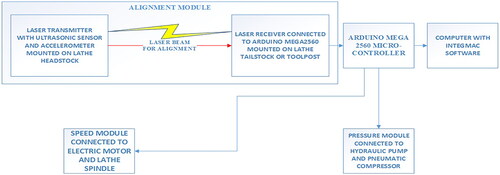
Figure 7. Schematic Sketch of Mechatronic System mounted on Lathe.
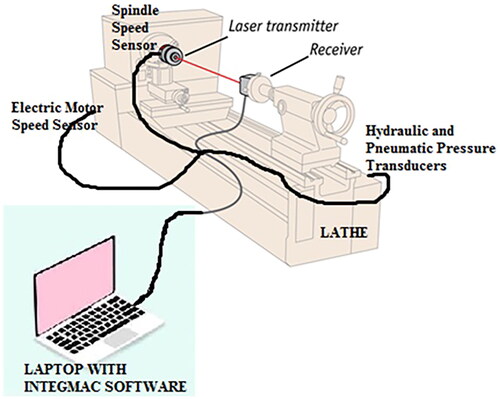
Figure 8. Developed Integrity Evaluator.
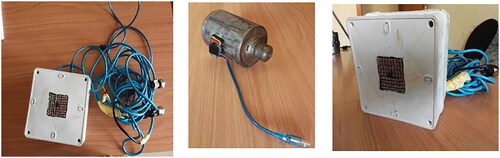
Table 3. Results of component calibration.
Figure 9. Spindle Speed Integrity Chart.
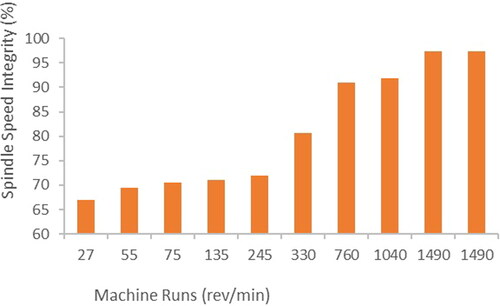
Figure 10. Electric Motor Speed Integrity Chart.
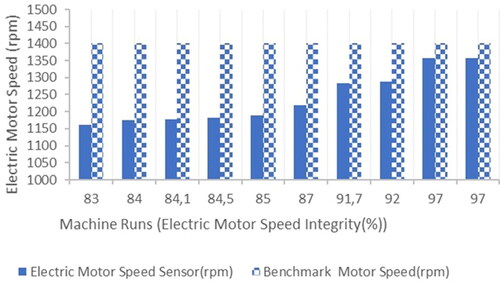
Figure 11. Hydraulic pressure integrity chart.
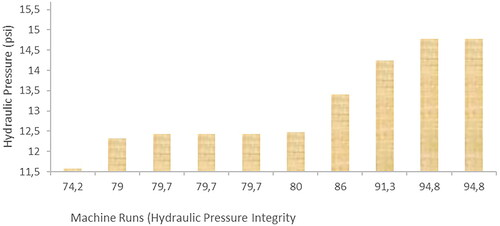
Figure 12. Pneumatic Pressure Integrity Chart.
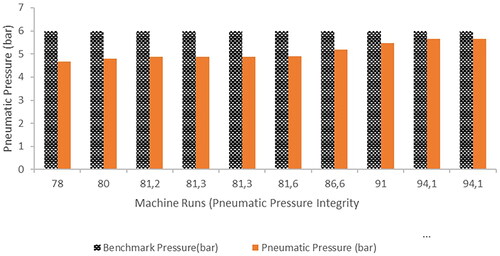
Figure 13. Headstock-Tailstock/Toolpost Alignment.
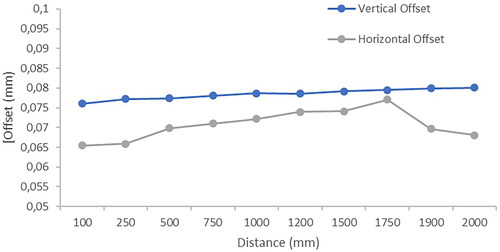
Figure 14. Developed LDR Alignment.
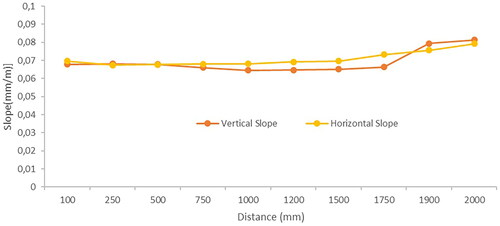
Figure 15. Total alignment integrity chart.
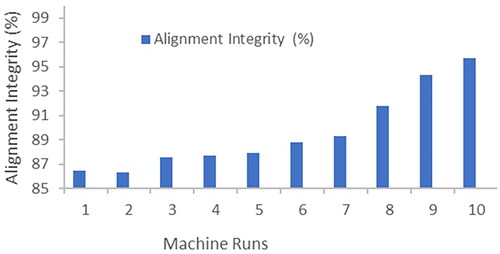
Figure 16. Total Machine Integrity Chart.
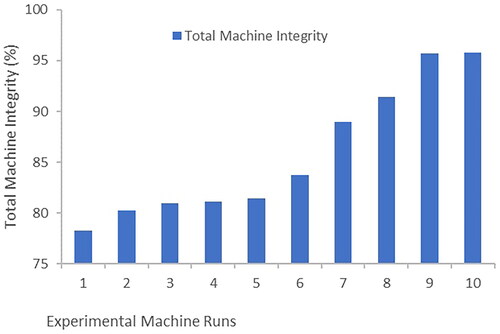
Table 4. Total machine integrity.
Figure 17. Online Paired T-Test Simulator.
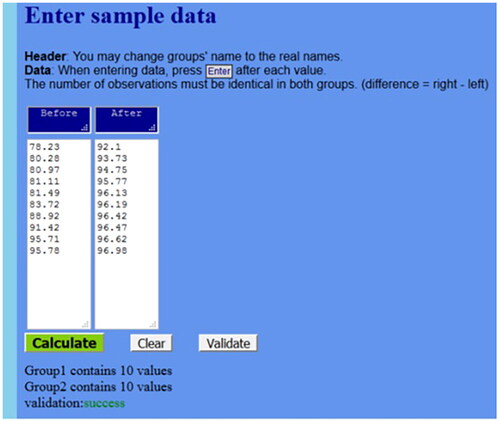
Table 5. Results of performance evaluation on developed mechatronic system.
Table 6. Machine tool accuracy assessment.
Data availability statement
The data that support the findings of this study are available from the corresponding author upon reasonable request.