
Figures & data
Figure 1. Molds prepared for fabrication of composite specimens.
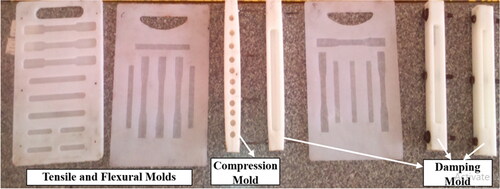
Figure 2. Various granite powder mesh sizes used for composite preparation.
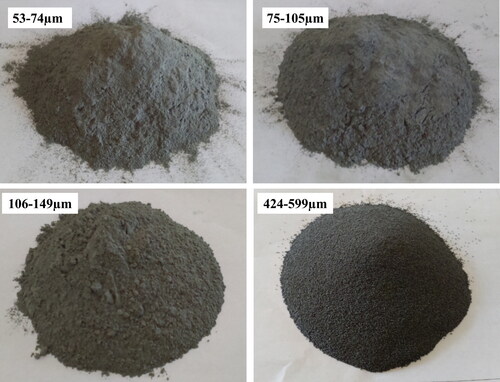
Figure 3. Composite specimen preparation methodology.
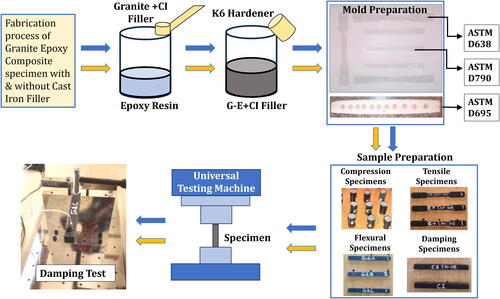
Figure 4. Specimens for compression and tensile experimental tests (a) compression specimens; (b) Composite mixture poured into mold cavity; (c) Tensile test specimens of G-E composite; (d) Tensile test specimens of G-E composite with CI filler material.
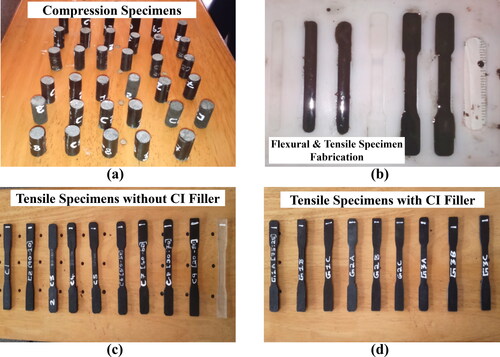
Table 1. Material composition for granite epoxy (G-E) specimens without cast iron filler particulates.
Table 2. Material composition for granite epoxy (G-E) specimens with cast iron filler particulates.
Figure 5. Specimens for flexural and damping experimental tests (a) Flexural test specimens of G-E composite; (b) Flexural test specimens of G-E composite with CI filler; (c) Damping test specimens of G-E composite; (d) Damping test specimens of G-E composite with CI filler.
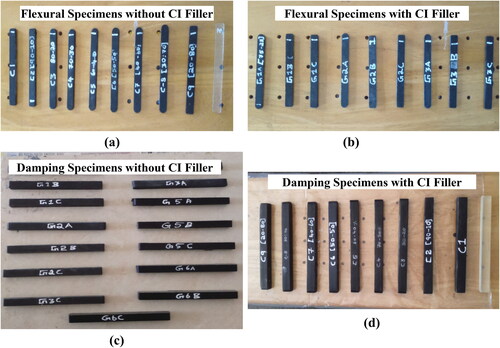
Figure 6. Compression test of G-E composite in H75KS UTM.
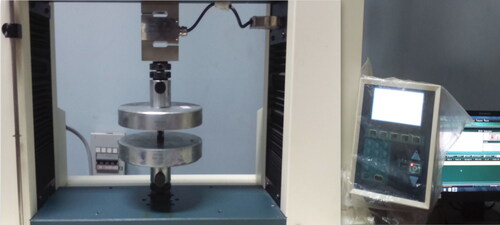
Figure 7. Specimen clamped onto the tensile test fixture and flexural test of G-E composite specimens.
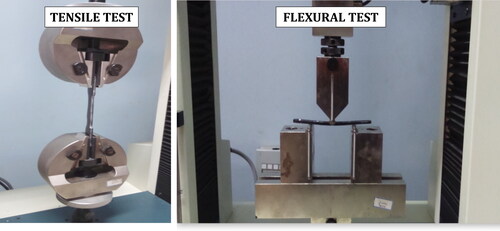
Figure 8. Schematic diagram of damping test.
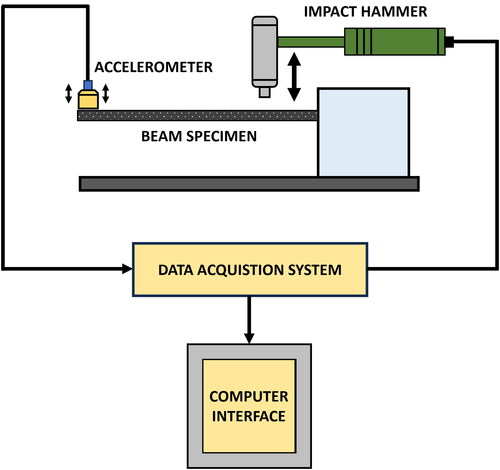
Figure 9. Damping test performed in cantilever setup and computer interface with LABVIEW Software.
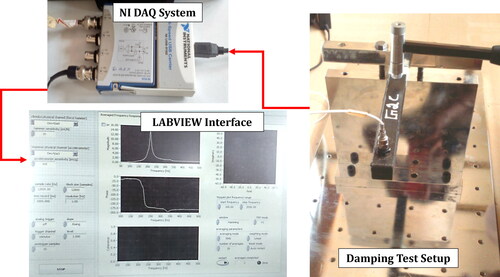
Figure 10. Compression test results. (a,b) Compressive strength of G-E specimens (0, 5%, 10% and 15% CI Filler) (c,d) Modulus of Elasticity of G-E specimens (0, 5%, 10% and 15% CI Filler).
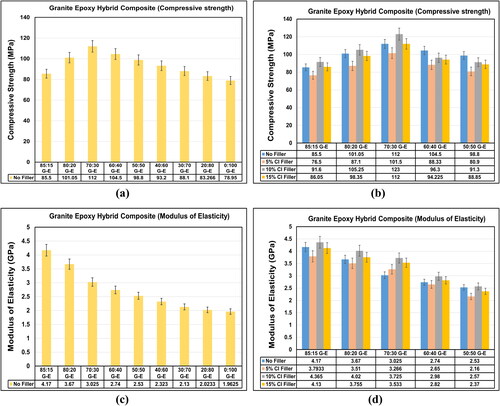
Figure 11. Tensile test results. (a,b) Tensile strength of G-E specimens (0, 5%, 10% and 15% CI Filler) (c,d) Modulus of elasticity of G-E specimens (0, 5%, 10% and 15% CI Filler).
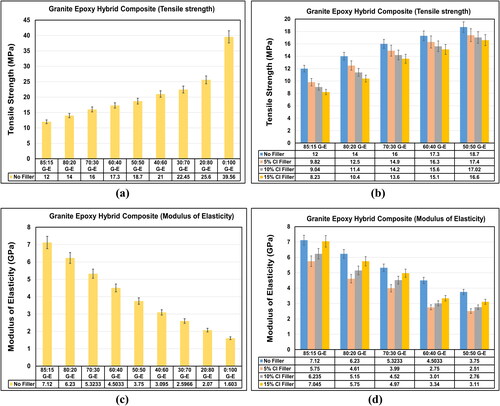
Figure 12. Flexural test results. (a,b) Flexural strength of G-E specimens (0, 5%, 10% and 15% CI Filler) (c,d) Modulus of Elasticity of G-E specimens (0, 5%, 10% and 15% CI Filler).
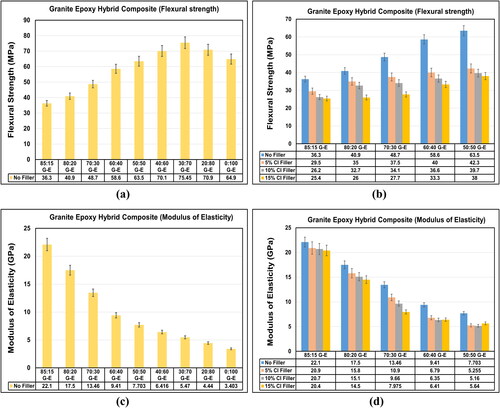
Figure 13. Density test results (a) Density of G-E specimens with no CI Filler; (b) Density of G-E specimens with 5%, 10% and 15% CI Filler).
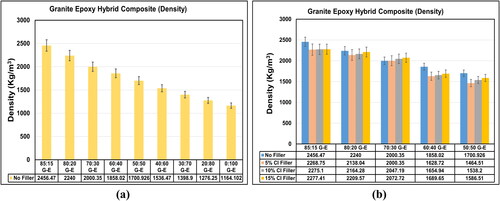
Figure 14. Variation in damping ratio and Logarithmic decrement. (a,b) damping ratio of G-E specimens (c,d) Logarithmic decrement of G-E specimens.
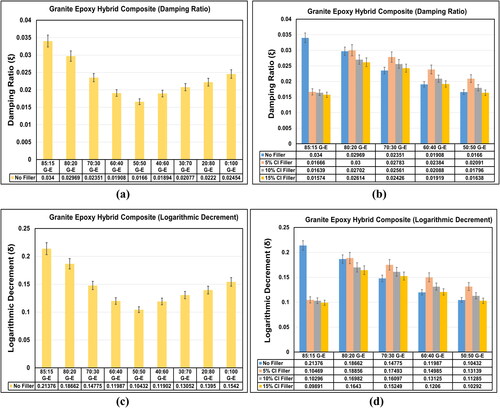
Figure 15. Fundamental Frequency curve (a) 85:15 Granite epoxy ratio; (b) 85:15 Granite epoxy ratio specimen with 5% CI Filler Material.
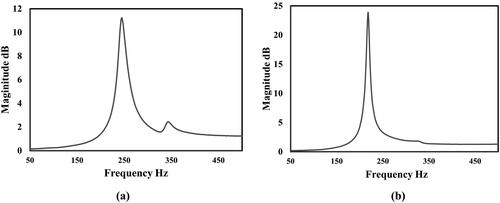
Figure 16. Geometric model of damping specimen after meshing specimen with 5% Cast Iron Filler Material.
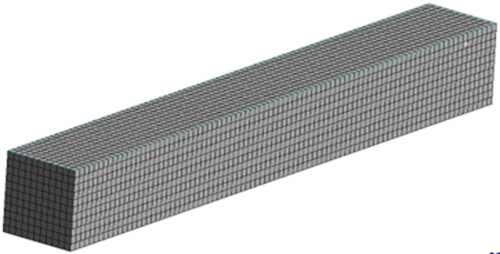
Figure 17. Grid independence test.
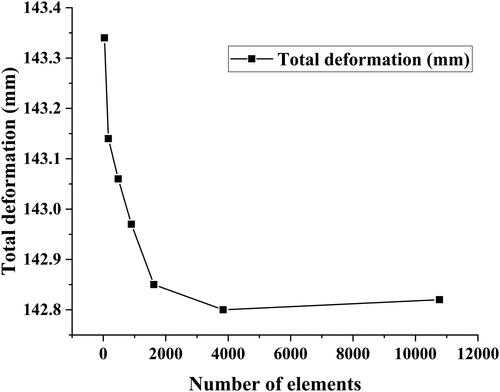
Figure 18. Six mode shapes of prepared 85:15 granite epoxy composite beam specimen using ANSYS Workbench.
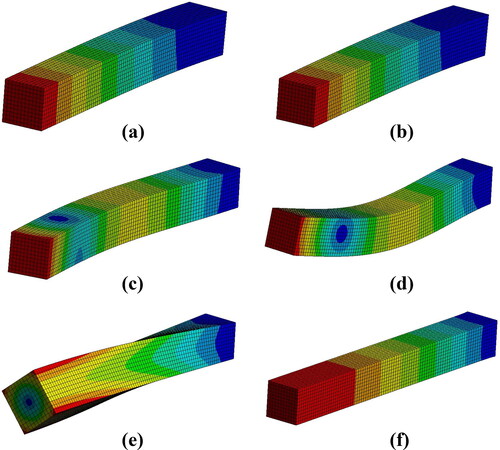
Figure 19. Six mode shapes of prepared 85:15 granite epoxy specimen with 5% cast iron Filler.
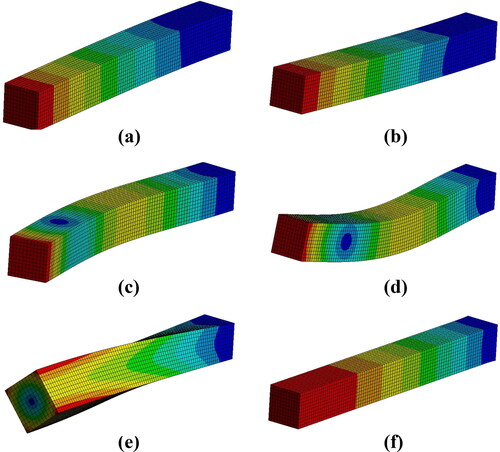
Table 3. Frequency output of modal analysis for 85:15 Granite epoxy composite specimen using ANSYS Workbench.
Table 4. Frequency output of modal analysis for 85:15 Granite epoxy specimen with 5% cast iron filler using ANSYS Workbench.
Figure 20. Variation in fundamental frequency and percentage deviation attained for experimental and ANSYS analysis for different compositions of granite epoxy composite specimens.
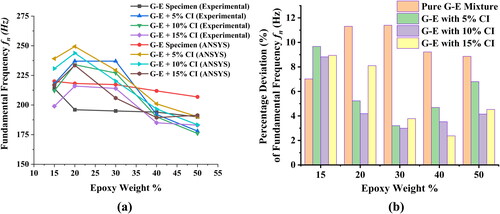
Figure 21. Variation in damping ratio and percentage deviation attained for different compositions of granite epoxy composite specimens.
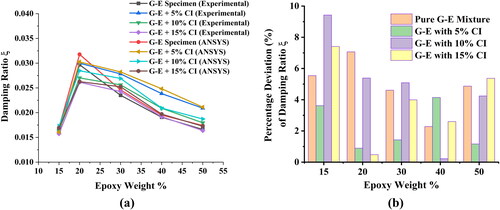
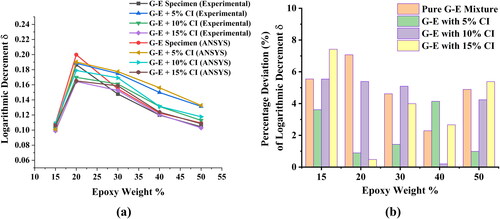
Figure 22. Variation in logarithmic decrement and percentage deviation attained for different compositions of granite epoxy composite specimens.
Data availability statement
Data will be made available on request. Author to be contacted for data: Girish Hariharan ([email protected])