
Figures & data
Table 1. Overview of LM applications in literature in the context of manufacturing industry.
Table 2. Parameters/metrics/for current state analysis of classical VSM.
Table 3. Parameters/metrics/for current state analysis of extended VSM.
Figure 1. Assembly process chart.
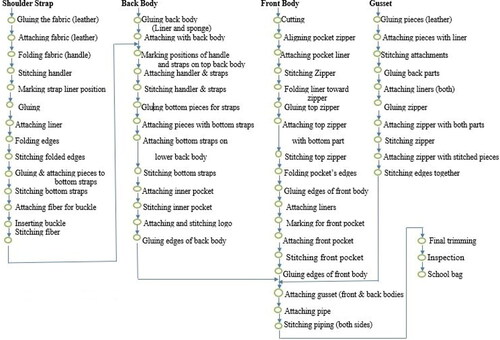
Figure 2. Conceptual integration model for VSM and DES.
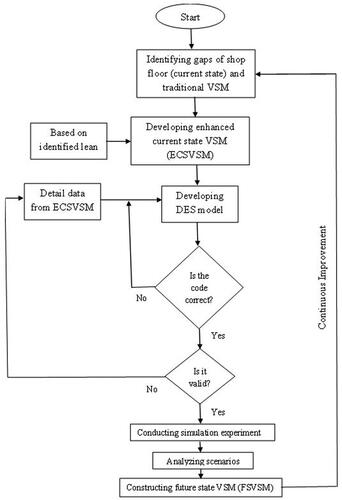
Table 4. Product matrix.
Figure 3. Summary of enhanced current state VSM.
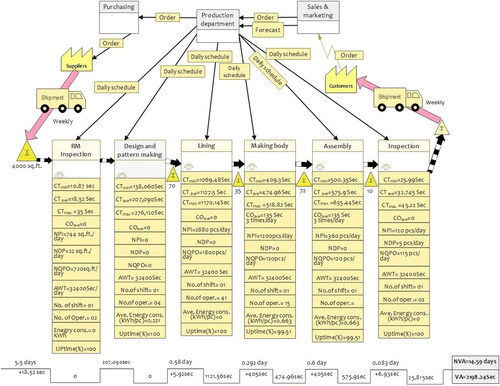
Figure 4. As-Is simulation model.
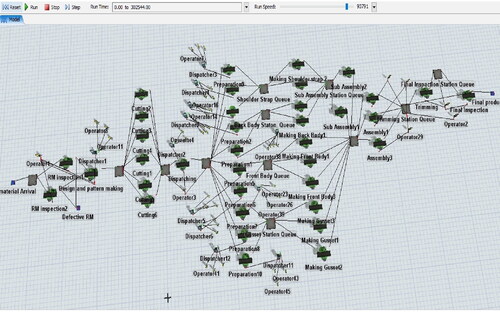
Table 5. As- Is simulation experiment results for waiting time and WIP inventory.
Table 6. As-Is simulation experiment summary.
Figure 6. WIP waiting for the process.
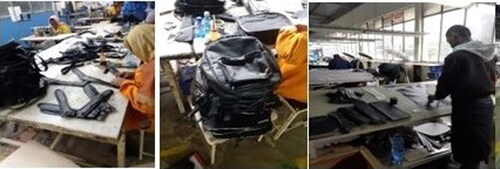
Figure 7. Over produce WIP in various stations and finished goods.
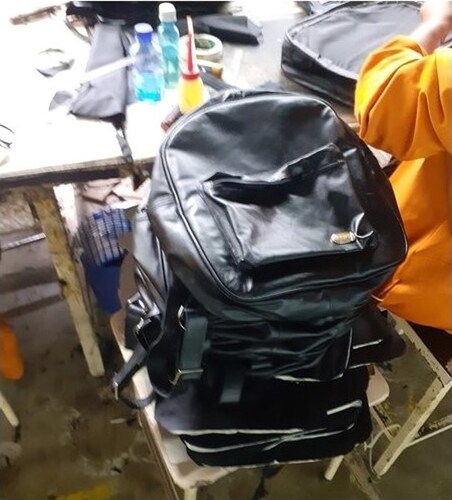
Figure 8. Overview of transport distance in shop floor value streams.
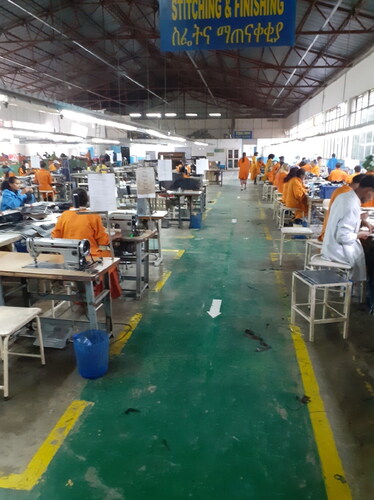
Figure 5. WIP inventories in various station queue.
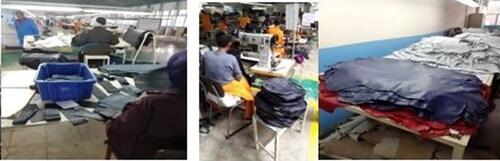
Figure 9. Cutting operation in standing position.
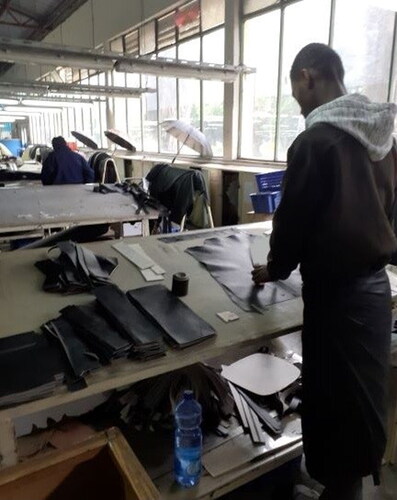
Table 7. Equivalent time value of identified wastes.
Figure 10. Pareto diagram for identified wastes.
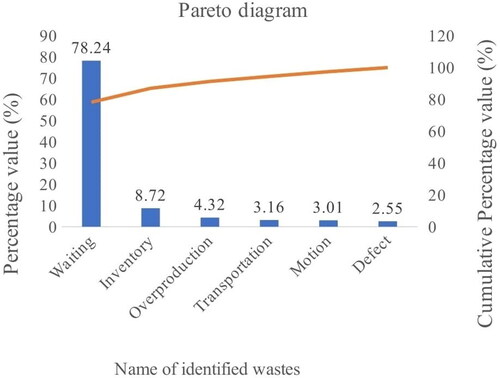
Figure 11. Sample experiment results for 133 WIP level.
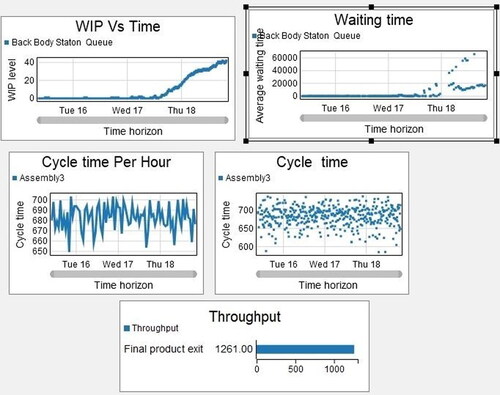
Table 8. Impact of varying WIP level.
Table 9. Summarized results of simulation experiment for proposed scenarios.
Figure 12. Developed To-Be simulation model.
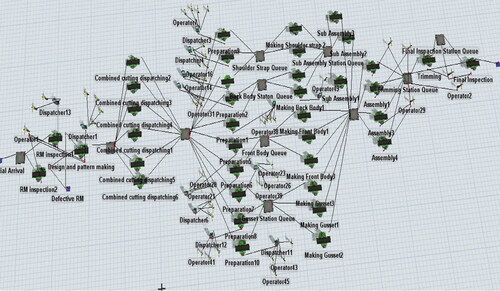
Figure 13. Dynamic behavior of sample value stream in the To-Be model.
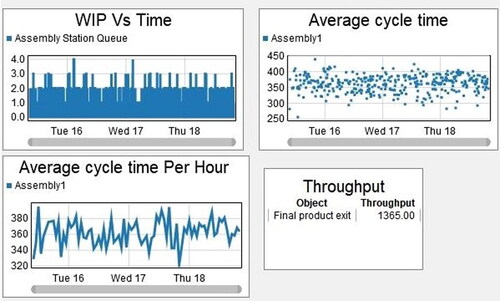
Figure 14. Developed future state VSM.
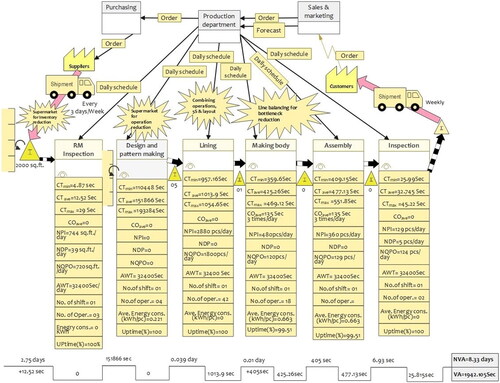
Table 10. Result comparison.
Data availability statement
The data that support the findings of this study are available from the corresponding author, upon reasonable request.