
Figures & data
Figure 1. Components in multi-processor operating system.
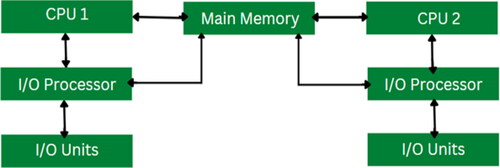
Figure 2. Process of beam search.
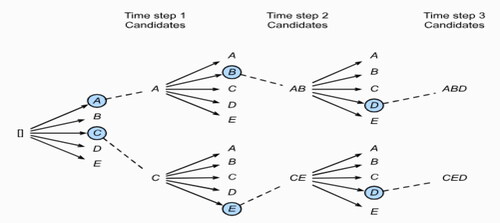
Figure 3. Integrated algorithm in multi-processor system.
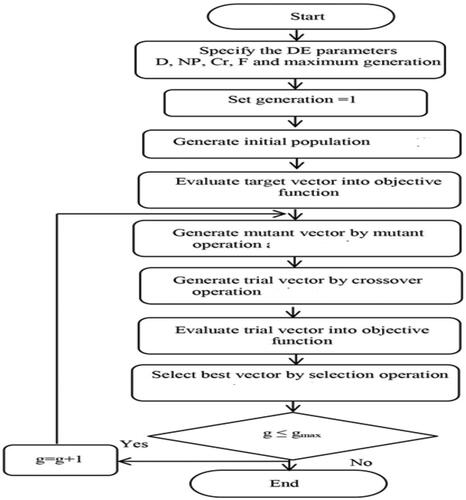
Table 1. Displays a typical job set comprising its operations and corresponding node codes.
Figure 4. Visualization of nodes within the beam.
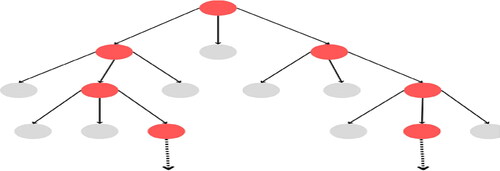
Table 2. Neighboring nodes in a beam with width 2 and branching factor 2.
Table 3. The computation of the cost function for J2 and L2.
Table 4. The computation of the cost function for J5 and L1.
Table 5. Performance strategies and improvement.
Figure 5. Load balancing of AMRs.
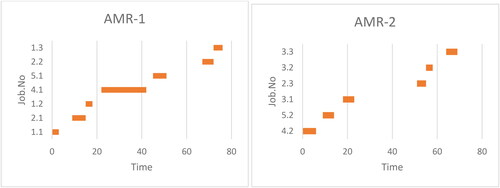
Figure 6. Load balancing of SMPs.
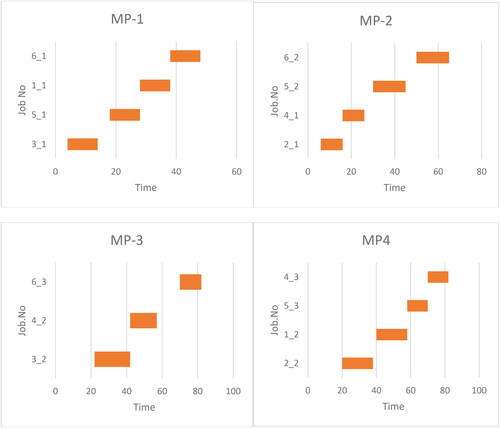
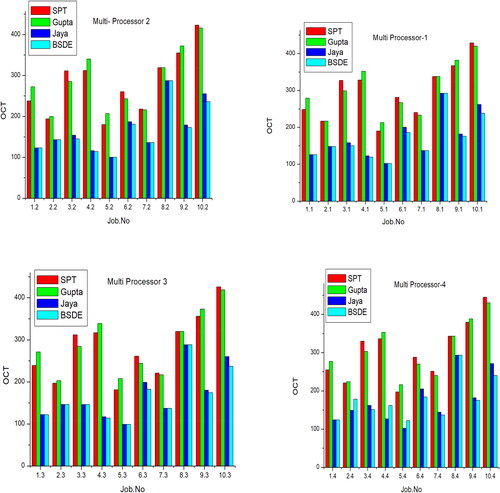
Figure 7. Comparative results of multi-processor.
Data availability statement
The original contributions presented in the study are included in the article; further inquiries can be directed to the corresponding author.