
Figures & data
Figure 1. Flow diagram for random forest regression.
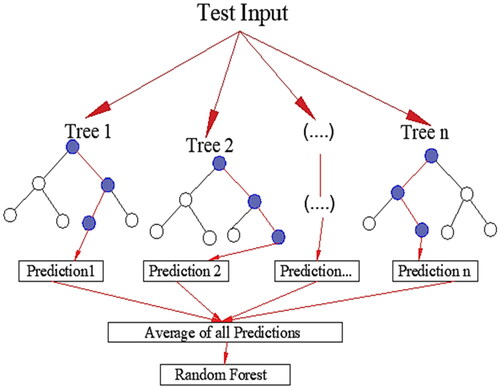
Figure 2. Flow diagram for AdaBoost regression.
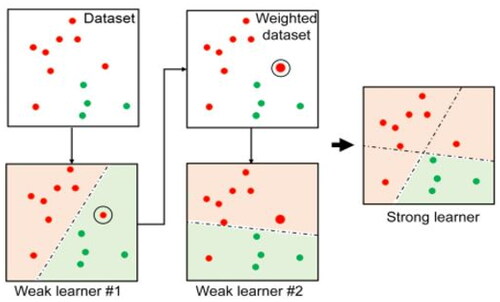
Figure 3. Experimental plan.
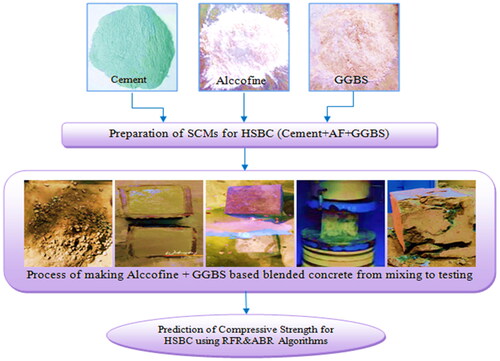
Table 1. Limits of each feature used to prepare the concrete.
Figure 4. Correlation matrix.
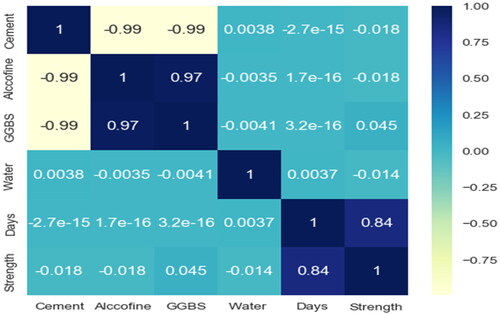
Table 2. Statistical characteristics of experimental data.
Figure 5. Methodology for development of ML model.
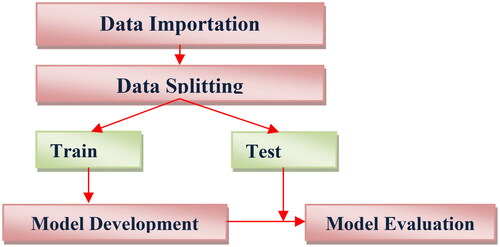
Figure 6. Compressive strength of observed and predicted against testing sample of (a) random forest regression and (b) AdaBoost regression.
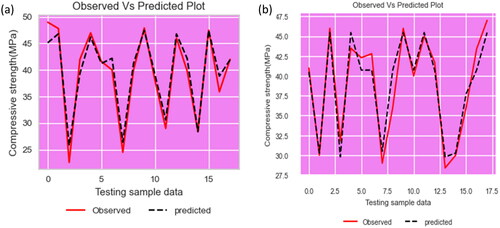
Table 3. Training and testing measures of regression models.
Figure 7. Comparison of performance metrics of (a) training and (b) testing for random forest regression and AdaBoost regression.
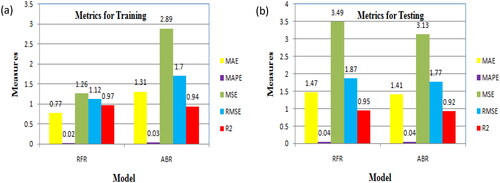
Figure 8. Comparison of prediction error plots for (a) random forest regression and (b) AdaBoost regression.
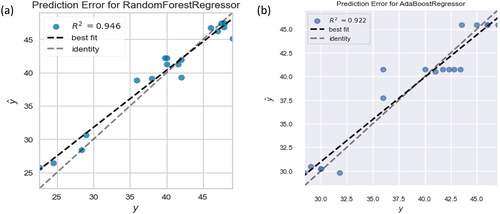
Figure 9. Comparison of residual plots for (a) random forest regression and (b) AdaBoost regression.
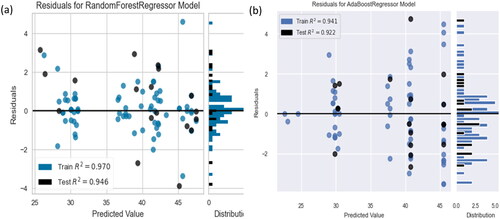
Figure 10. Comparison of feature importance for (a) random forest regression and (n) AdaBoost regression.
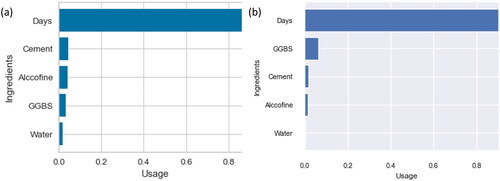
Figure 11. Integration of ANN and GA.
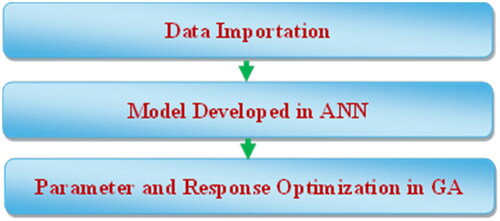
Figure 12. ANN architecture between input and response.
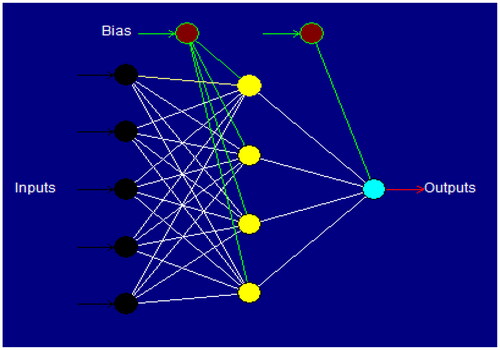
Figure 13. ANN model for compressive strength.
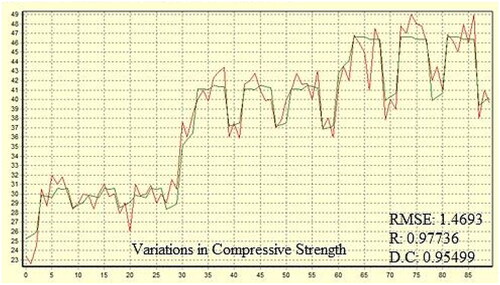
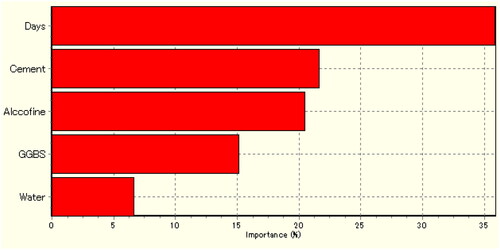
Figure 14. Factors of importance (%) on CS.
Data availability statement
The data that support the findings of this study are available from the corresponding author, [C Vivek Kumar], upon reasonable request.