
Figures & data
Figure 1. Steps in the proposed model.
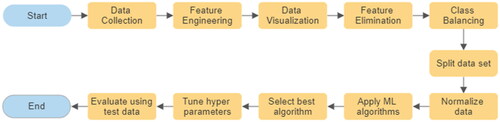
Figure 2. Dataset.
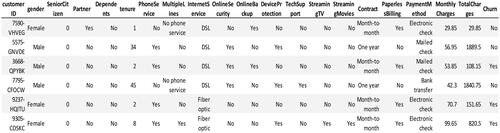
Figure 3. Distribution of data in categorical features.
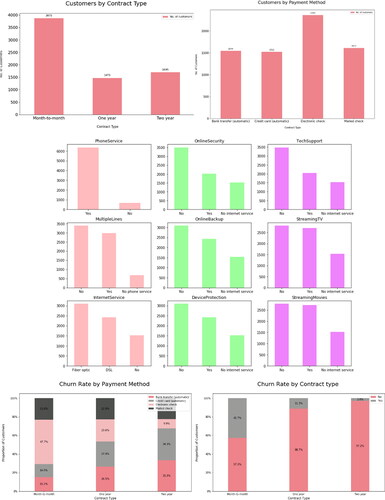
Figure 4. Correlation heat map.
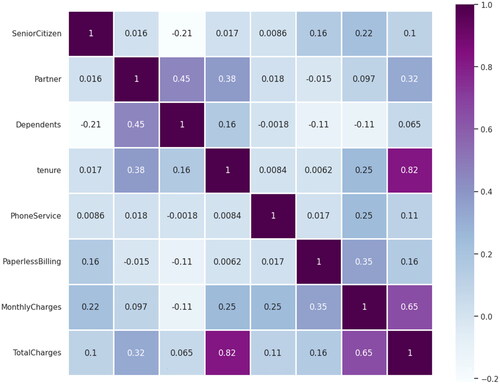
Figure 5. Weightage of classes of dependent feature – Churn.
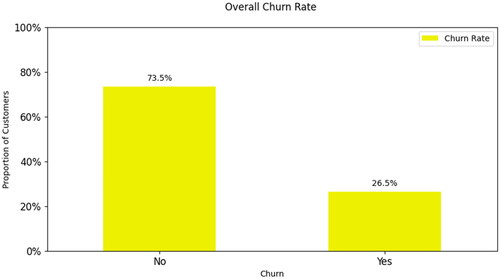
Figure 6. Performance of classification algorithms.
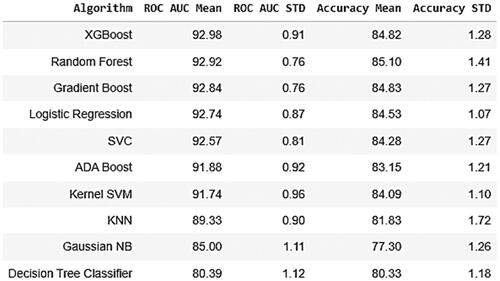
Figure 7. Accuracy metrics of classification algorithms on Train data.
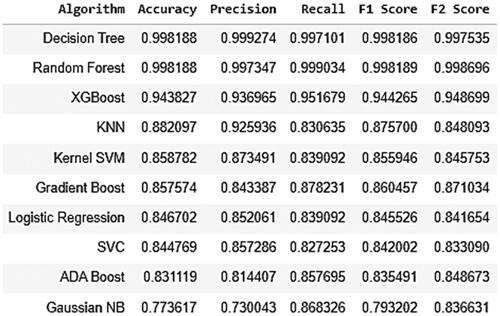
Figure 8. Accuracy metrics of classification algorithms on Test data.
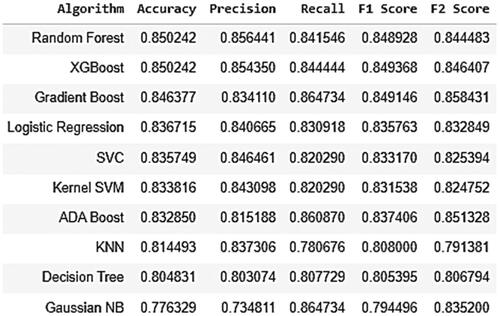
Figure 9. Confusion matrices for train set and test set.
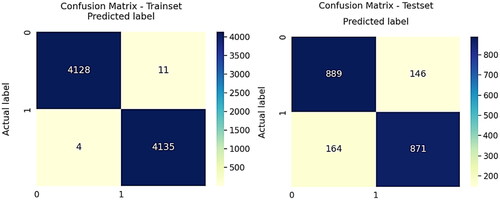
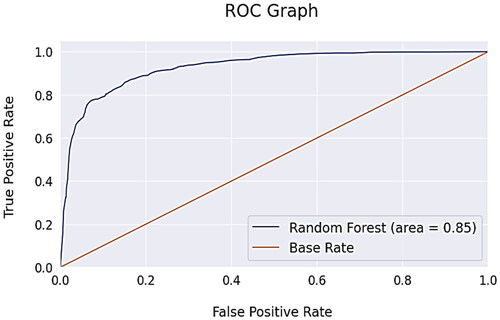
Figure 10. AUC-ROC graph.
Data availability
The data supporting the findings of this study is accessible and can be provided upon request from the corresponding author.