
Figures & data
Table 1. An overview of the several methods for determining all the parameters of a PV cell/module/panel.
Figure 1. Organization of paper.
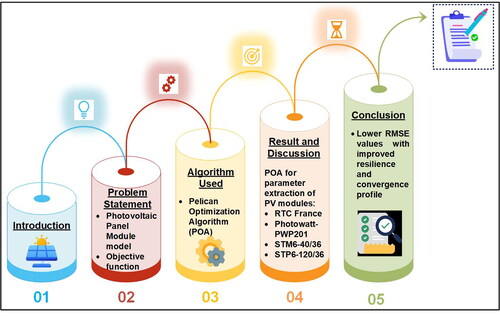
Figure 2. Single diode model of photovoltaic panel module.
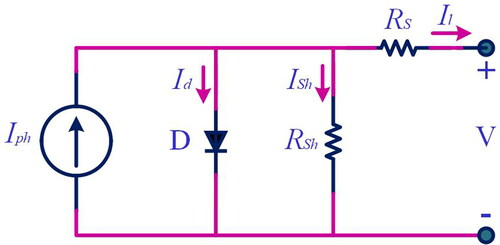
Figure 3. Flowchart of POA algorithm.
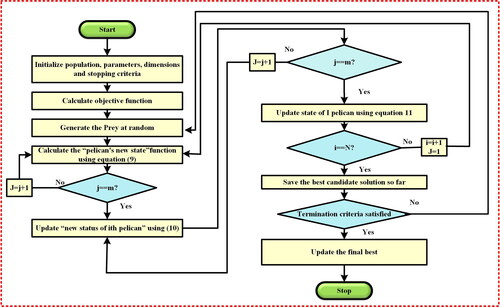
Table 2. The range of variables or parameters in the PV model.
Table 3. Results of different PV Modules obtained using POA.
Figure 4. The measured and calculated curves’ characteristics of SDM: (a) V–I curve, (b) V–P curve and (c) convergence characteristics.
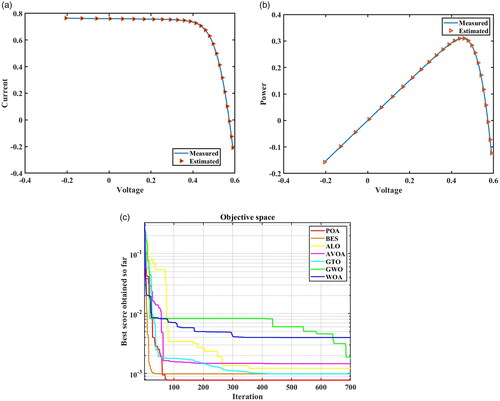
Table 4. The results of POA's computed current and absolute error for a SDM.
Table 5. Comparison of POA results with other MH optimization methods in RTC literature (SDM).
Figure 5. The measured and calculated curves’ characteristics of Photowatt-PWP201 PV module: (a) V–I curve, (b) P–V curve and (c) convergence curve.
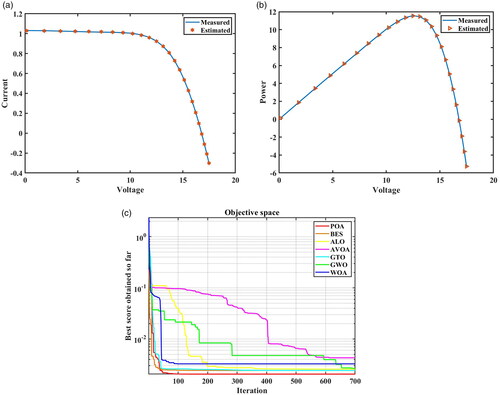
Table 6. The results of POA’s computed current and absolute error for a Photowatt-PWP201 PV module.
Table 7. Comparison of POA results with other MH optimization techniques in Photowatt-PWP201 PV module.
Figure 6. The measured and calculated curves’ characteristics of STM6-40/36 PV module: (a) V–I curve, (b) V–P curve and (c) convergence curve.
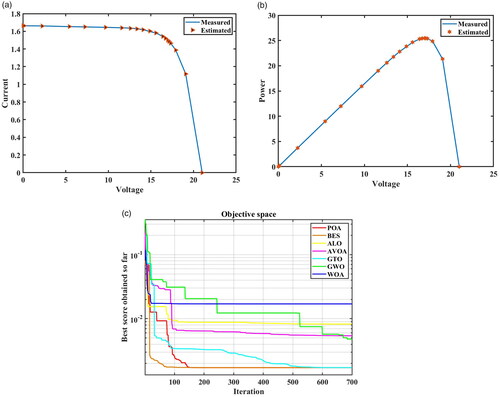
Table 8. The results of POA's computed current and absolute error for a STM6-40/36 PV module.
Table 9. Comparison of POA results with other MH optimization techniques in STM6-40/36 PV Module.
Figure 7. The measured and computed curves’ characteristics of STP6-120/36 module: (a) V–I curve (b) V–P curve and (c) convergence curve.
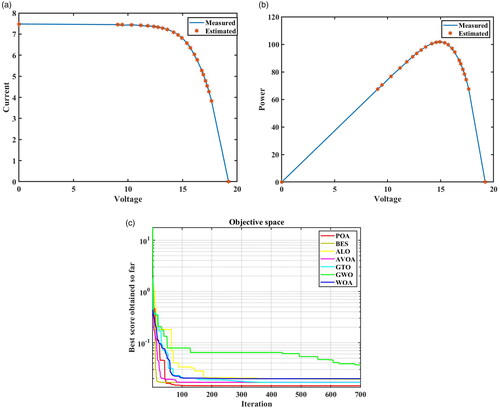
Table 10. The results of POA's computed current and absolute error for a STP6-120/36 module.
Table 11. Comparison of POA results with other MH optimization techniques in STP6-120/36 module.
Data availability statement
All the necessary data pertaining to the simulations has been included in the manuscript in the form of tables and figures. Additional information will be provided on request.