Figures & data
Figure 1. FTIR spectra of sunflower oil (SO) samples heated at temperatures ranging from 125 to 225°C for 6 h
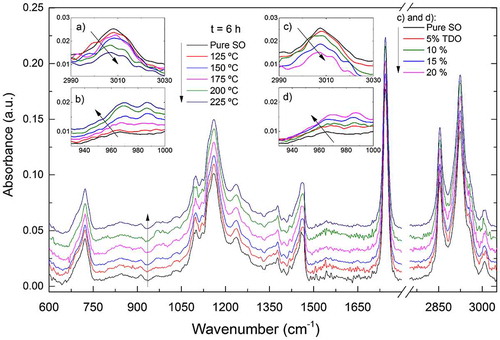
Figure 2. Observation diagram of a principal component analysis for the differentiation of sunflower oil (SO) samples deteriorated using a set of different conditions using FTIR-ATR spectral data
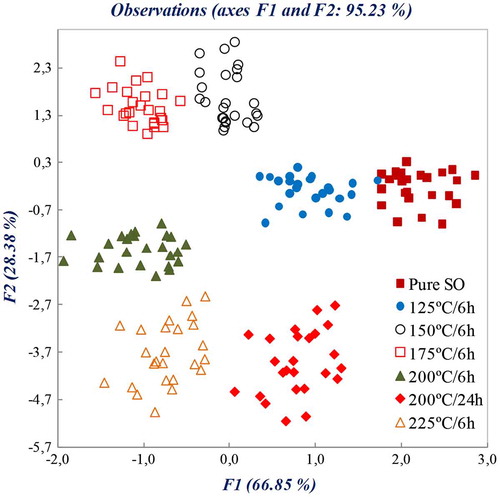
Figure 3. Measured spectra together with its first and second derivatives for sunflower oil (SO) samples, thermally deteriorated sunflower oil (TDO, 200°C/24 h), and SO adulterated with 5, 10, 15, and 20% of TDO (sub-set of Set B)
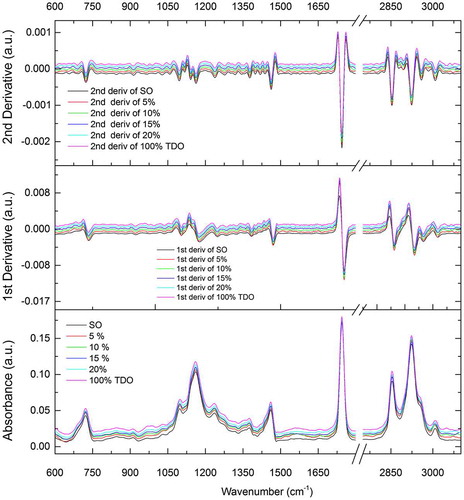
Figure 4. Similarity map as determined by discriminant analysis using factors DF1 and DF2 for FTIR-ATR spectral data of pure sunflower oil (SO), thermally deteriorated sunflower oil (TDO), and SO mixed with thermally deteriorated sunflower oil (SO/TDO) (samples with less than 5% of TDO deteriorated at 200°C for 24 h)
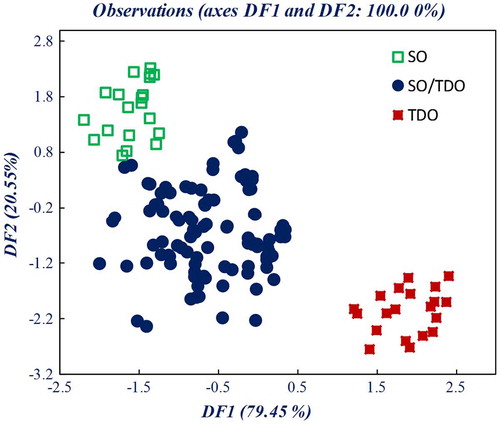
Table 1. Confusion matrix for the classification of pure SO, TDO, and SO/TDO (samples with less than 5% of TDO). Results for calibration and cross-validation. Observed classifications in the rows. Predicted classifications in columns
Table 2. Principal component regression (PCR) and partial least squares regression (PLS-R) models-based calibrations for quantification of adulteration of SO with TDO using standard normal variate (SNV) spectral data and its first and second derivatives
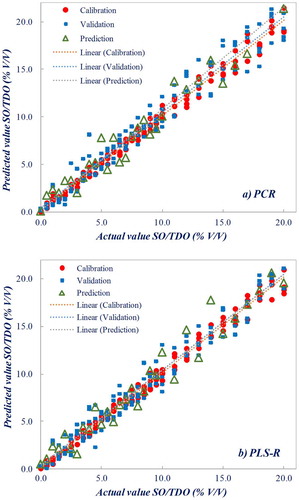
Figure 5. Quality of the models for the relationship between measured concentration of thermally deteriorated sunflower oil (TDO) in pure sunflower oil (SO) samples and predicted values based on FTIR spectra: (a) PCR model and (b) PLS-R model, using first derivative of spectral data