Figures & data
Table 1. Timeline of major events related to cotton sector reforms in Ghana and Burkina Faso
Figure 1. Key cotton production trends for Ghana and Burkina Faso: (a) area harvested, (b) production quantity, (c) yield. Sources: FAOSTAT (Citation2016), ICAC (Citation2016).
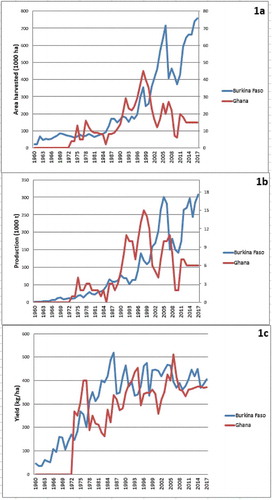
Figure 2. Market share of cotton production in Ghana and Burkina Faso: (a) percentage share of production in SSA; (b) percentage share of production in West Africa. Sources: FAOSTAT (Citation2016), ICAC (Citation2016).
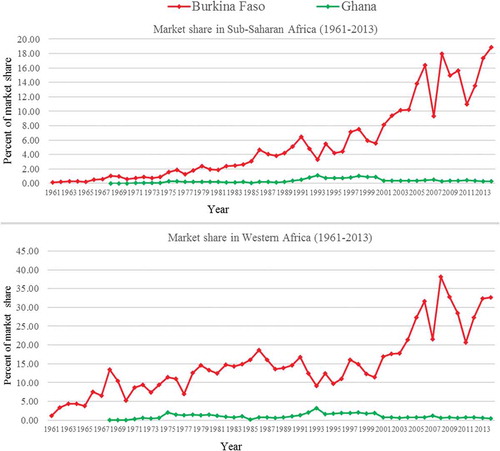
Figure 3. Map of Western Africa showing Ghana and Burkina Faso and cotton production zones, prepared by authors.
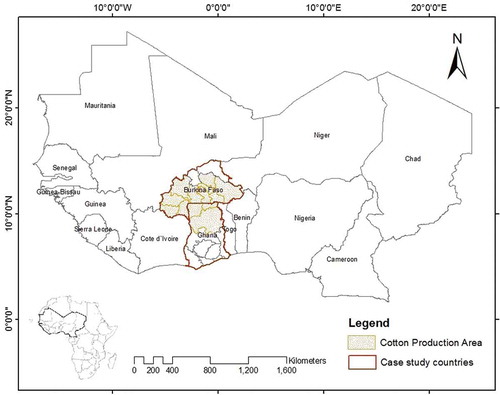
Table 2. Details of the stakeholders interviewed for the study
Figure 4. Stakeholder perceptions of reform outcomes on input credit systems.
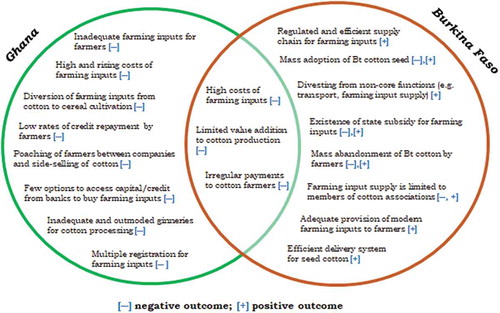
Figure 5. Stakeholder perceptions of reform outcomes on price determination and profit distribution.
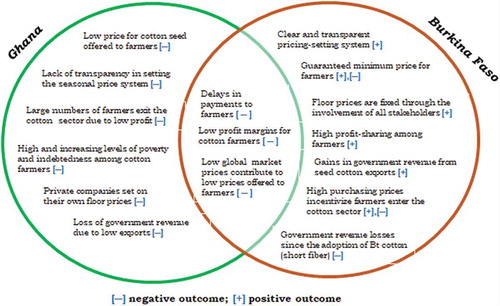
Figure 6. Stakeholder perceptions of reform outcomes on extension services.
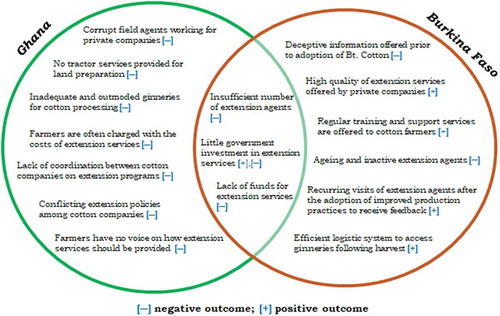
Figure 7. Stakeholder perceptions of reform outcomes on research and development.
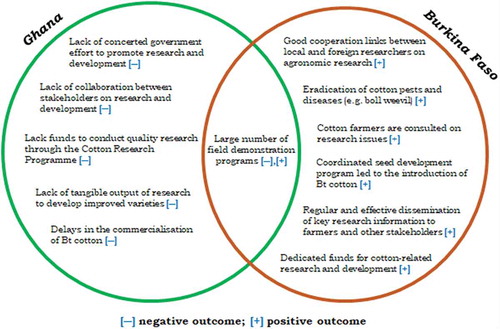
Figure 8. Stakeholder perceptions of reform outcomes on institutional and regulatory systems.
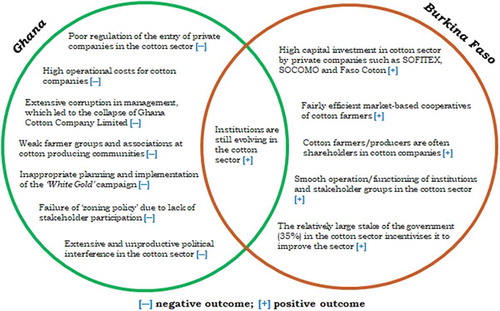
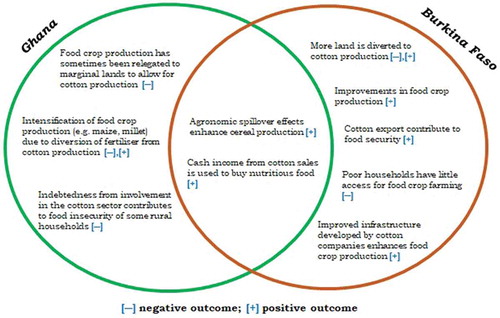
Figure 9. Stakeholder perceptions of reformoutcomes on food security.