Figures & data
Table 1. Sample farm household characteristics for Pakistan and Uzbekistan, in proportion of respondents, unless indicated otherwise, 2016
Figure 1. Land use during the kharif season in Pakistan’s Pothwar region among mungbean growers and non-growers.
Table 2. Mungbean production practices in Pakistan and Uzbekistan, in proportion of respondents unless indicated otherwise, 2016
Figure 2. Mungbean seed sources as reported by growers in Pakistan, in percent of respondents, 2016.
Note: Pothwar region (n = 50), southern Punjab (n = 62) and Sindh province (n = 53).
Table 3. Mungbean area, yield and prices and selling practices in Pakistan and Uzbekistan, average per farm household, 2016
Table 4. Cost and returns to mungbean production by region in Pakistan, in USD per hectare, average per farm household, 2016
Figure 3. Labor use in mungbean production (left) and the relative contribution of male, female and child labor in manual and mechanized mungbean production (right), Pakistan, 2016.
Note: Pothwar region (n = 50), southern Punjab (n = 62) and Sindh province (n = 53).
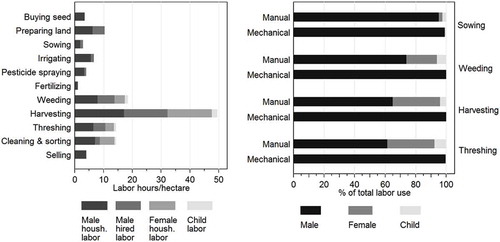
Table 5. Mungbean consumption by smallholder farmers in Pakistan and Uzbekistan, 2016
Table 6. Perceptions about mungbean among farmers that did not cultivate it, in proportion of respondents, 2016
Table 7. Perceived constraints to mungbean production among growers and non-growers, in proportion of respondents, 2016
Figure 4. Pest and disease problems in mungbean as perceived by growers in Pakistan and Uzbekistan, 2016.
Notes: Pakistan includes Pothwar region, southern Punjab and Sindh province; Uzbekistan includes Fergana, Tashkent and Karakalpakstan regions.