
Figures & data
Table 1. Description of variables used in the logistic regression model
Table 2. Mean of the variables used in propensity score matching regression model
Figure 1. Distribution of estimated propensity scores and common support for the treated and control groups.
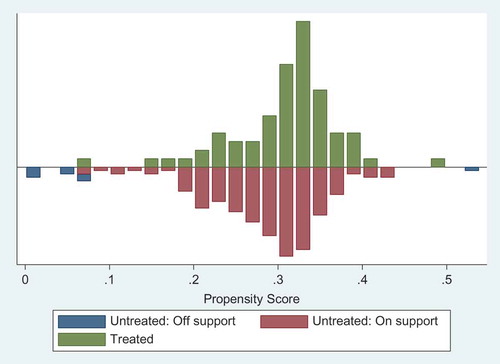
Table 3. Average treatment effect for smallholder vegetable farmers’ income (USD)
Appendix A. Factor influencing smallholder vegetable farmers’ access to markets
Appendix B. Performance of different matching estimators
Appendix C. Propensity score, covariate balance, and chi-square test for the joint significance of variables
Appendix D. Result of sensitivity analysis using the mh bounding approach of Mantel-Haenszel (Citation1959) bounds for variable income