Figures & data
Figure 1. Mean monthly temperature (a) and total precipitation (b) for the study area during the study period (October 2016–May 2017) and the long-term period from 2002 to 2016.
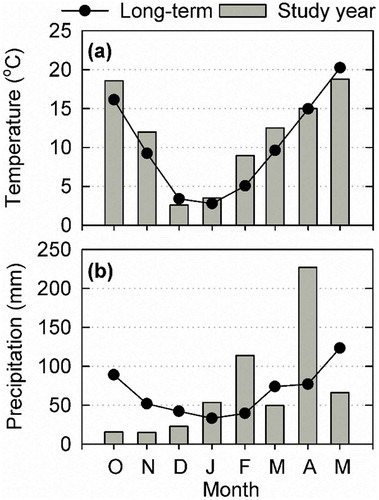
Figure 2. Dynamics of ratio vegetation index (RVI) as a proxy for green biomass. Error bars represent the spatial variations at plots (standard error, n = 3). Unidirectional error bars are shown for clarity.
Figure 3. Dynamics of ratio vegetation index (RVI) as a proxy of green biomass at no-till and conventional-till systems. Each point represents average RVI across all forms of applied N treatments under a tillage system. Error bars represent the spatial variations at plots (standard error, n = 12). Unidirectional error bars are shown for clarity.
Figure 4. Cumulated intercepted fPAR (IPAR) of winter wheat during the study period (October 2016–May 2017). The data represent averages of three plots under each N treatment. Spatial varations at plot scale are presented as standard error (n = 3) for the final measurement. Unidirectional error bars are shown for clarity.
Figure 5. Mean aboveground dry matter (DM) yield of winter wheat. Error bars represent the spatial variations at plots (standard error, n = 3). Significance level for tillage (T) system, nitrogen (N) treatments and their interaction are shown.
Figure 6. Mean root/shoot ratio of winter wheat harvested in the end of the growing season. Error bars represent the spatial variations at plots (standard error, n = 3). The ratio was not statistically different (P > 0.05) in all tillage system and N treatment combinations.
Figure 7. Mean radiation use efficiency (RUE) of winter wheat. (a) RUE calculated based on aboveground dry matter yield (b) RUE calculated based on total (root and shoot) dry matter yield. The RUEs were not statistically different (P > 0.05) in all tillage system and N treatment combinations.