Figures & data
Figure 1. Map showing study area and soil sampling locations in the eastern part of the Dang district of Nepal.
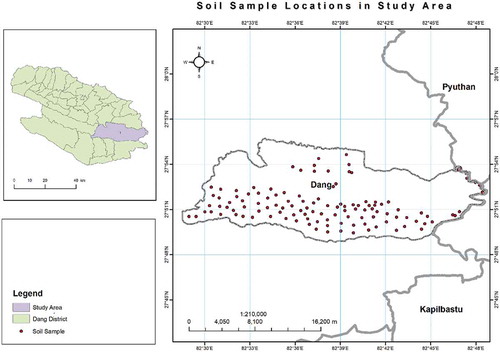
Table 1. Soil chemical analysis methods followed by regional soil testing laboratory, Kaski, Nepal
Table 2. Rating for different soil chemical parameters given by the Soil Management Directorate, Department of Agriculture for the Terai region of Nepal
Figure 2. Values (mean ± SE) of a) soil fraction and b) bulk density based on land use types of the Dang district of Nepal.
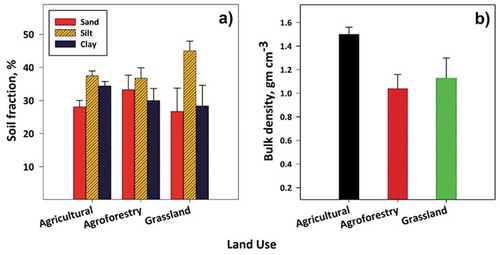
Table 3. Spatial variability of soil chemical properties among land use in the eastern part of the Dang district of Nepal
Table 4. Area covered by land use under different soil categories based on soil fertility parameters in the eastern part of the Dang district of Nepal
Figure 3. Soil pH1:2 water spatial variability map in the eastern part of the Dang district of Nepal. Most of the study area had moderately alkaline (57.50%) followed by neutral (27.81%) and strongly alkaline (14.68%) pH. Moderately acidic pH was present in a very small area (0.01%) that cannot be seen in the variable map.
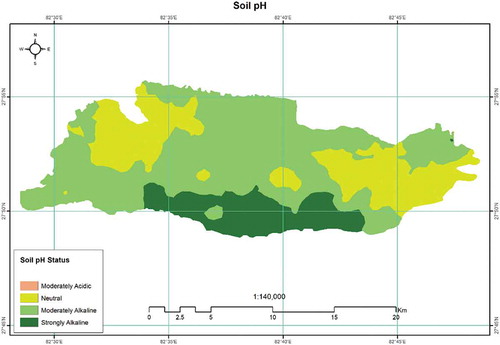
Figure 4. Soil OM spatial variability map in the eastern part of the Dang district of Nepal. The study area was dominated by low (69.40%) and medium (30.60%) OM content.
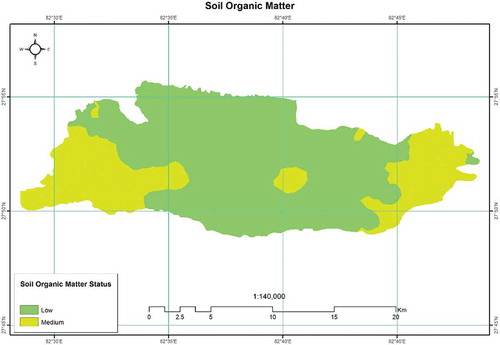
Figure 5. Soil N spatial variability map in the eastern part of the Dang district of Nepal. Most of the study area had medium (77.16%) soil N content. High soil N was present in less than 2% of the total area.
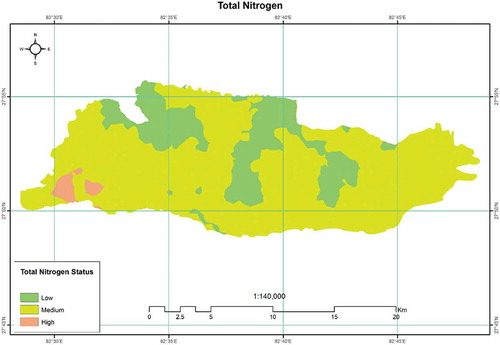
Figure 6. Soil P spatial variability map in the eastern part of the Dang district, Nepal. Most of the study area had low (60.18%) and medium (37.32%) P content. Only 2.20% of the study area had a high P content in the soil.
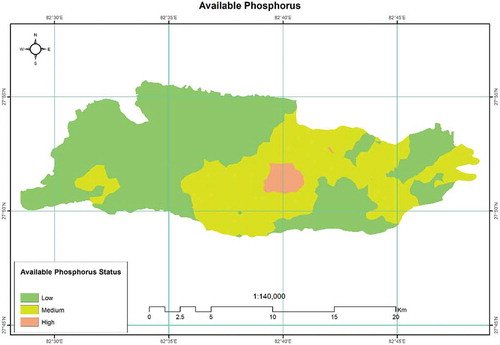
Figure 7. Soil K spatial variability map in the eastern part of the Dang district, Nepal. The study area was dominated by medium (50.51%), followed by high (44.26%) and very high (3.99%) K content. Only 1.25% of the study area had low K content in the soil.
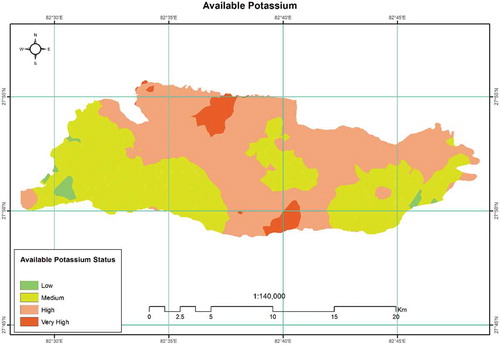
Figure 8. Soil B spatial variability map in the eastern part of the Dang district, Nepal. Most of the study area had very low (52.70%) and low (46.44%) B content. Soil B at medium levels was present in less than 1% of the total area.
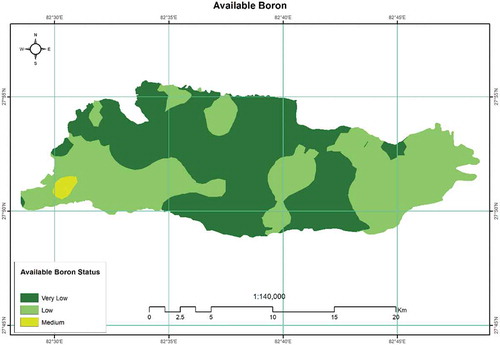
Figure 9. Soil Zn spatial variability map in the eastern part of the Dang district, Nepal. All of the study area had a very low level of Zn content.
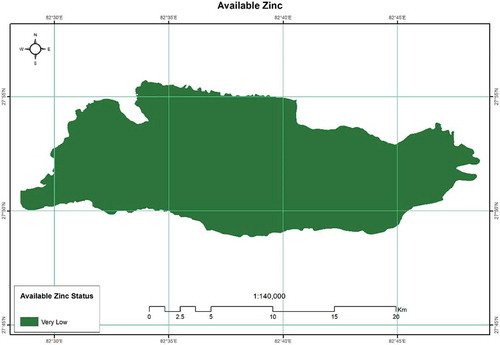
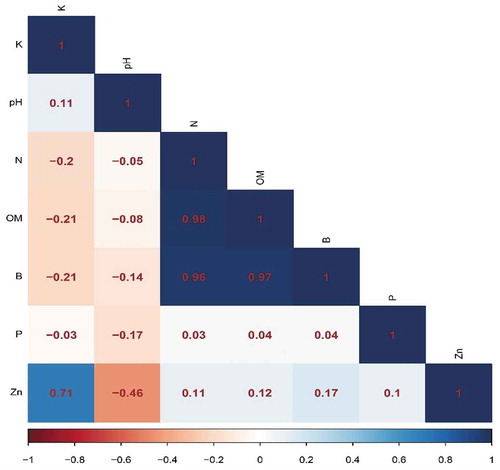
Figure 10. Correlation matrix based on Pearson’s correlation coefficients between soil chemical properties in the eastern part of the Dang district of Nepal.