Figures & data
Figure 1. (a) Location of the study area in Uganda, Mt. Elgon region, (b) elevation map of the Mt. Elgon region and (c) land cover map of the Mt. Elgon region.
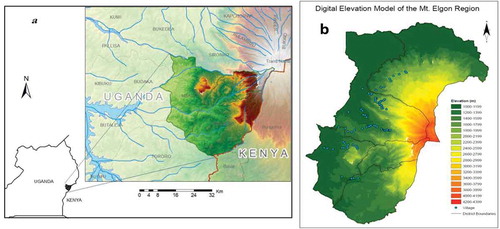
Table 1. Selected variables for intensification land management pathway characterisation
Table 2. Summary statistics of independent variables used in PCA and cluster analysis
Table 3. Principal components analysis Verimax rotated components
Table 4. Final cluster centres for four clusters identified through K-means clustering
Figure 2. Dendrogram of clusters of coffee-banana farms based on intensification.
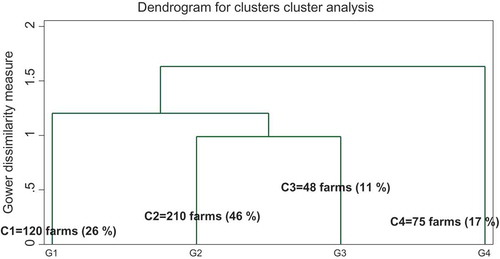
Figure 3. Boxplots showing: (a) Coffee yield variation by elevation and cluster, (b) coffee yield by variety and cluster, (c) coffee yield by elevation and variety and (d) banana yield by elevation and cluster.
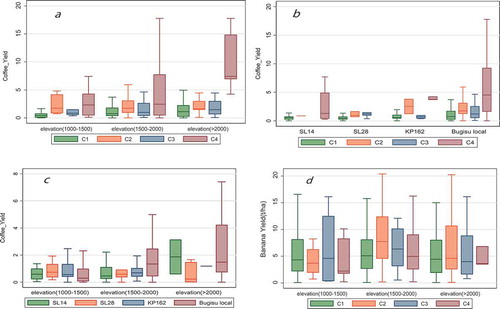
Figure 4. Authors’ illustration of the distribution of the SI land management clusters on the mountain landscape at three altitude ranges.
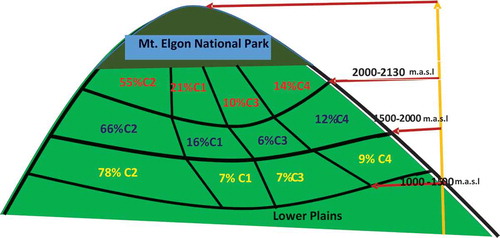
Figure 5. Percentage of farms in each cluster by study sites.
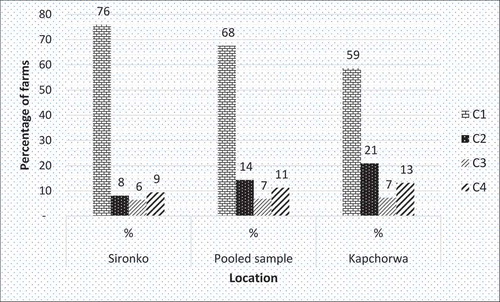
Figure 6. Location of clusters by the distance from the national park boundary.
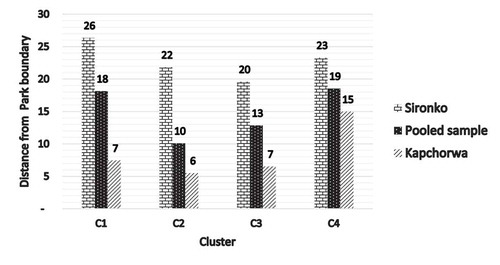
Table 5. Intensification factors affecting coffee yield based on gamma distributed GLM with log link
Table 6. Intensification factors affecting banana yield based on gamma distributed GLM (log link)
Table 7. Spearman’s correlation matrix
Table 8. Estimates for the adoption of coffee-banana intensification pathways by multinomial logistic regression
Table 9. Effect of elevation on the independent variables used in PCA and cluster analysis