
Figures & data
Figure 1. Average monthly rainfall (mm) and temperature (°C) of the surveyed (AM = Arbaminch, MA = Mihirab Arbaya, DG = Demba Gofa, KN = Konso, BR = Burjdi, DR = Derashie and BN = Bonkie) districts, Southern Ethiopia, during the 2016 and 2017 main cropping seasons.
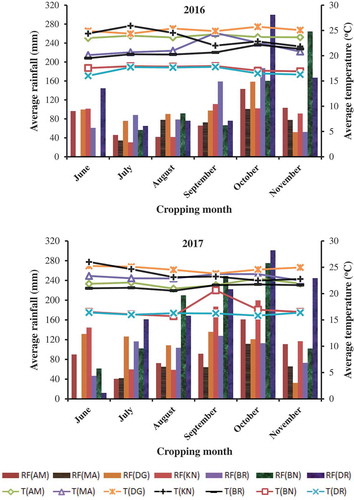
Figure 2. Map showing districts surveyed for maize lethal necrosis disease in Southern Ethiopia, during the 2016 and 2018 main cropping seasons.
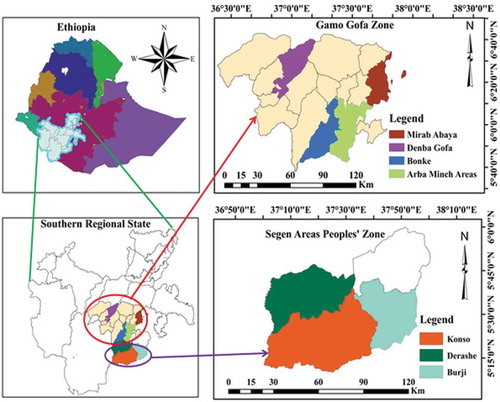
Table 1. Categorization of variables and independent variable x disease contingency table for logistic regression analysis of maize lethal necrosis disease severity (%) in seven districts (n = 240) of Southern Ethiopia, during the 2016 and 2017 main cropping seasons
Figure 3. Linear regression relating maize lethal necrosis disease severity (%) and weed population density (m−2) in maize fields in Southern Ethiopia, during the 2016 and 2017 main cropping seasons.
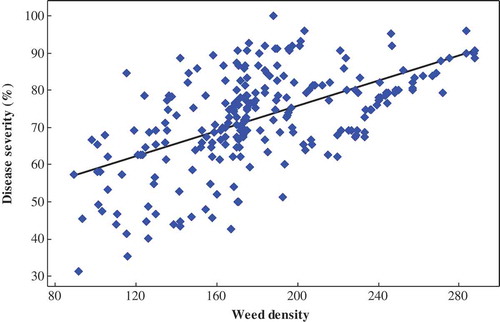
Table 2. Severity (mean ± SE) of maize lethal necrosis disease for different independent variables in the 2016 and 2017 main cropping seasons, Southern Ethiopia
Table 3. Logistic regression model for maize lethal necrosis disease severity (%) and likelihood ratio test on independent variables in Southern Ethiopia, during the 2016 and 2017 main cropping seasons
Table 4. Analysis of deviance, natural logarithms of odds ratio and standard error of maize lethal necrosis disease severity (%) and likelihood ratio test on independent variables in reduced regression model in Southern Ethiopia, during the 2016 and 2017 main cropping seasons