Figures & data
Scheme 1. Reaction mechanisms of single-electron transfer (SET) and hydrogen atom transfer (HAT).
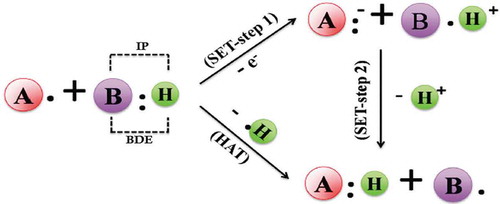
Figure 1. Mechanisms of antioxidant effects of honey (Al-mamary et al., Citation2002).
Figure 2. Total antioxidant activity of honey samples of different botanical origin (Aldina et al., Citation2015).
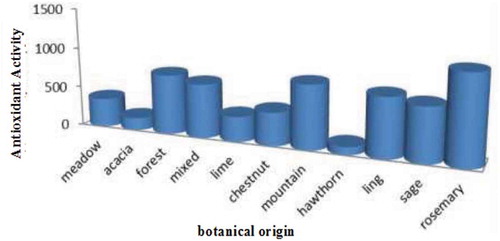
Table 1. Phenolic and Flavonoid content, and antioxidant activity of eleven Tualang honey samples (Siti et al., Citation2012)
Table 2. Correlation established between phenolic compounds and the antioxidant activity of Tualang honey samples (Siti et al., Citation2012)
Table 3. Correlation matrix showing the interrelation among phenolics, flavonoids, DPPH scavenging and FRAP assay for Malaysian honeys (Siti et al., 2013)
Figure 3. Correlation between polyphenol content and antioxidant activity of honey (Aldina et al., Citation2015).
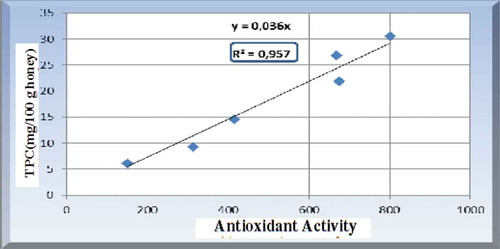
Table 4. Correlation matrix between antioxidant activity and biochemical components of honey (Lee et al., Citation2013)
Table 5. Pearson correlation matrixes for AAE-DPPH, TP, Color and TF (Natacha et al., Citation2014)
Table 6. Correlations between total phenolic contents and RSA of honey samples (Mekuanint & Meareg, Citation2019)
Table 7. Comparison of the analytical methods used for assessing the antioxidant activity (Ronald et al., Citation2005)
Scheme 2. Chemical structure of 2, 2-diphenyl-1-picrylhydrazyl (DPPH•).
Scheme 3. Conversion of Fe3+ TPTZ to Fe2+ TPTZ in FRAP assay.
Scheme 4. Reaction mechanisms in ORAC method.
Scheme 5. Formation of peroxyl radical (Joseph, Citation2004).
Figure 4. ORAC antioxidant activity expressed as the net area under the curve (Alberto, Carmen, & Begoña, Citation2004).
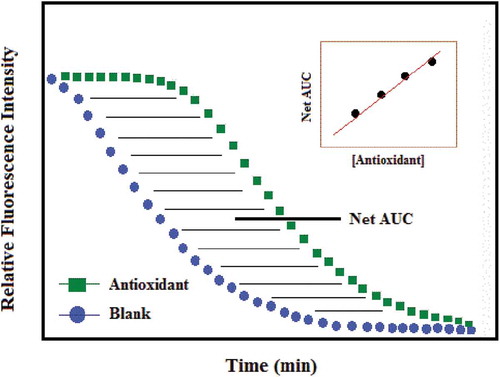
Figure 5. Kinetics of fluorescein (FL) quenching with different concentrations of Phycocyanobilin (PCB) versus blank. The reaction mixture contains 0.05 µM FL and 4 µM AAPH, with PCB ranging from 0.025 to 0.150 µM. (Inset) Linear plot of the net AUC versus PCB concentrations (Serena et al., Citation2010).
Figure 6. Time course of the reaction of fluorescein (FL) and β-phycoerythrin in the presence and in the absence of AAPH with and without antioxidant (wine) (Huang et al., Citation2002).