Figures & data
Figure 1. Scanning electron microscopy imaging system schematic diagram.
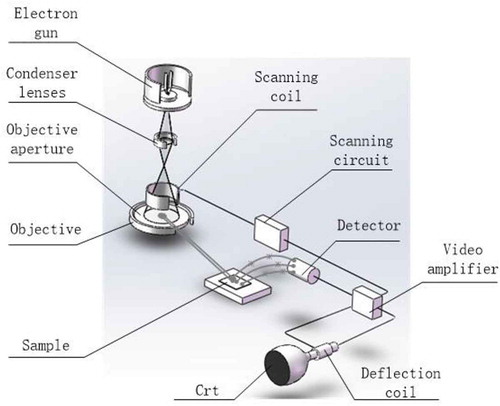
Figure 2. Comparison of the images and histograms of the gray images processed by histogram equalization (a) Histogram gray alfalfa image of the original image (b) Enhanced histogram of the alfalfa image (c) Gray alfalfa image (d) Enhanced alfalfa image.
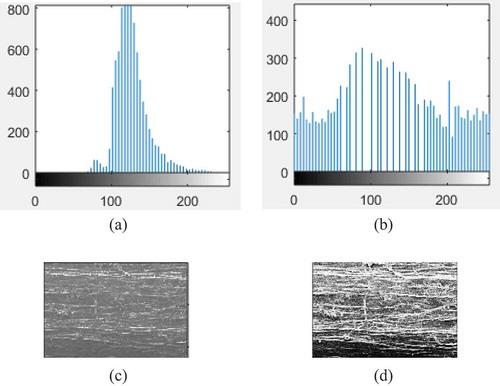
Table 1. Definition of each texture feature parameter
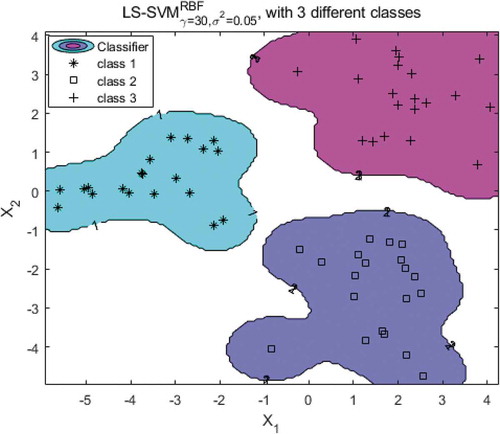
Figure 3. Cluster diagram of each different quality of dry alfalfa.
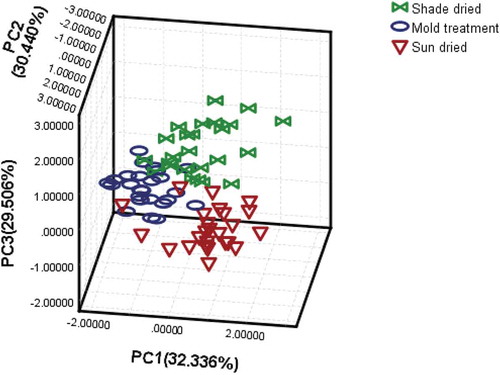
Figure 4. Score diagram of the two discriminant functions.
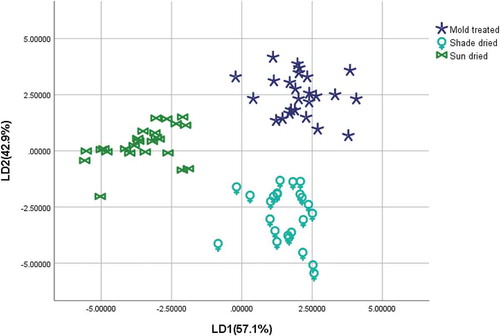
Table 2. Classification accuracy rate
Figure 5. Observation forecast chart.
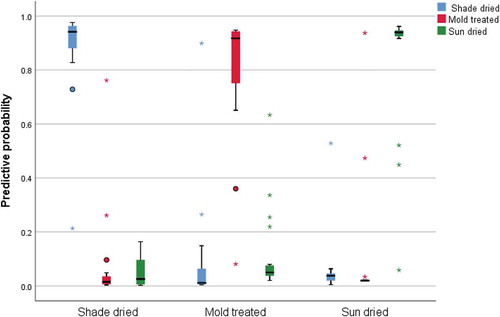
Table 3. Classification results
Figure 6. Observation forecast chart.
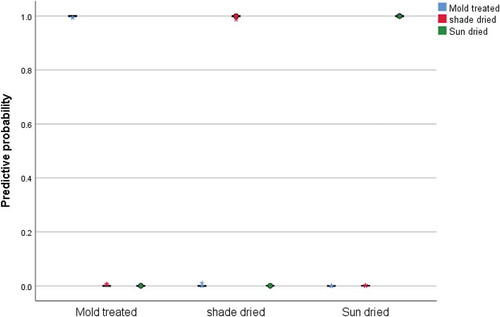
Table 4. Identification results of each model
Figure 7. PCA input results of the ANN model (a) Network training error curve (b) Schematic diagram of the neural network output value and target value comparison.
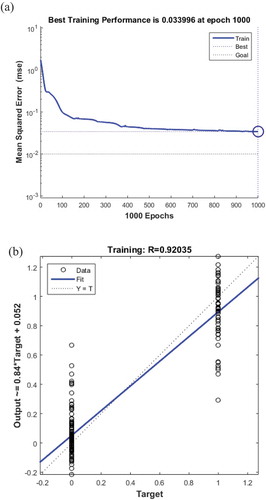
Figure 8. LDA input results of the ANN model (a) Network training error curve (b) Schematic diagram of the neural network output value and target value comparison.
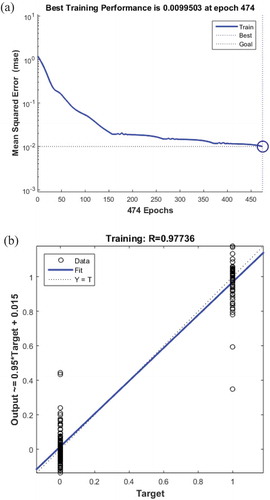
Figure 9. Classification results.
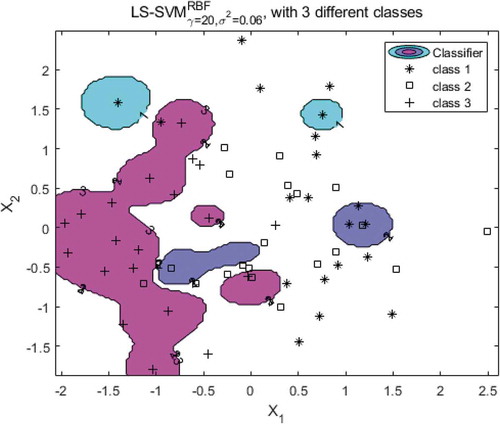
Figure 10. Classification results.