Figures & data
Table 1. Mean annual global production of grain legumes from 2008 to 2017
Table 2. Ethiopia’s production of major legume crops (‘000 metric tons)
Table 3. Contribution of various legume types and species to human food, livestock feed and soil fertility
Figure 1. Share of major grain legumes producing countries to global grain legumes production
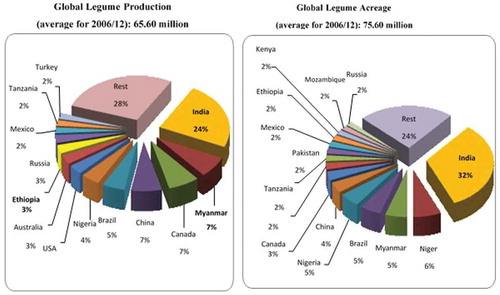
Figure 2. Share of major grain legume crops to global grain legumes production
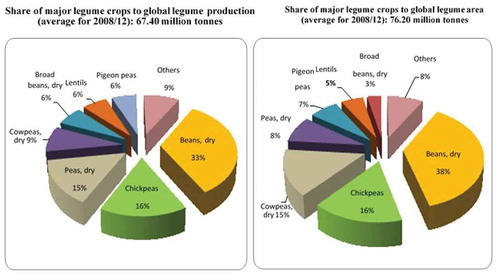
Figure 3. Percentage distribution of grain crop cultivated land and production in Ethiopia in 2017/2018 cropping season
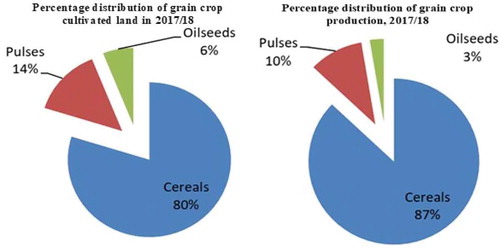
Figure 4. Average volume of production (in 000 quintals) of top four grain legume-producing regions in Ethiopia during the last 11 years (2008–2018)
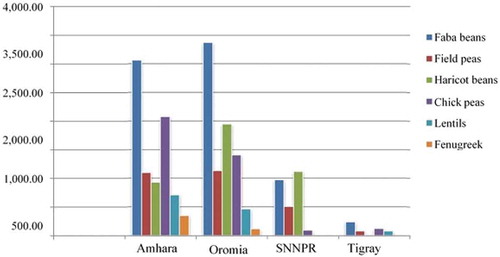
Figure 5. Trends of land size cultivated with different grain legumes in Ethiopia (in million hectares) during the production year of 2007/2008–2017/2018
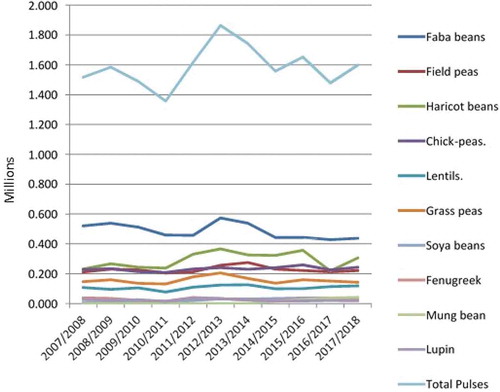
Figure 6. Trends of volume of production (in million quintals) of different grain legumes in Ethiopia during the production year of 2007/2008–2017/2018
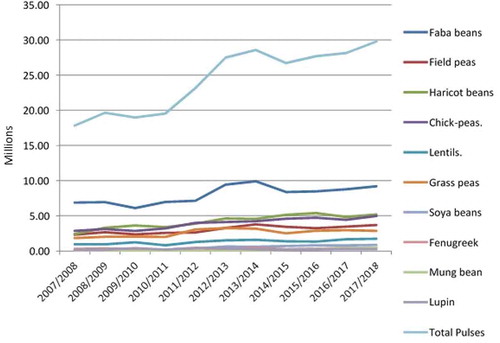
Figure 7. Protein provided by legumes per US$
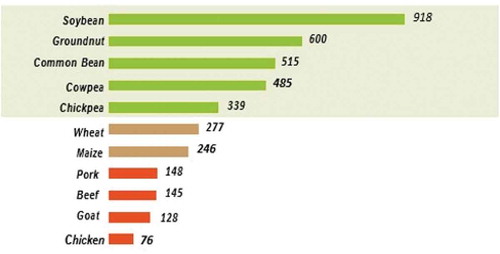
Figure 8. Trends in the share of grain legumes among the selected commodities to total export earnings
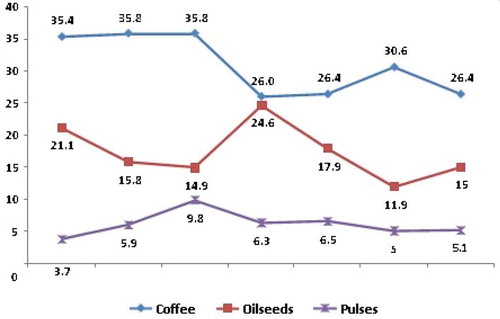
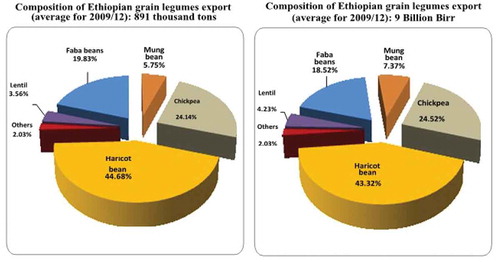
Figure 9. Composition of Ethiopian grain legumes export (2009/12) as computed from Ethiopian Revenue and Customs Authority Data