Figures & data
Figure 1. Map of the study area
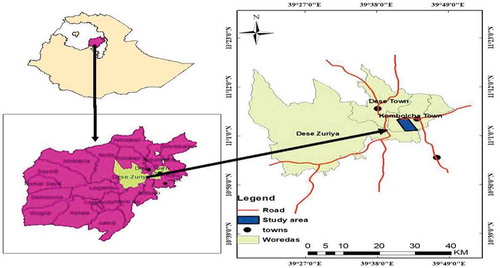
Figure 2. Weather condition of study area in the past 50 years. (RF – rainfall, Max. Temp – maximum Temperatures (oC) and Rel. Hum – Relative humidity (%))
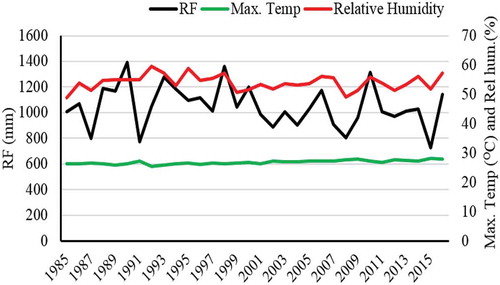
Figure 3. Diagram illustrating quadrat position in the study area (1 m × 1 m for herbaceous, little and soil sampling; 5 m × 5 m for shrub sampling; and 20 m × 20 m for tree sampling)
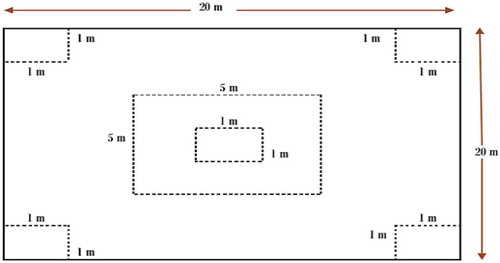
Table 1. Woody mean (±SD) above and below ground carbon stock of the three altitudinal gradients
Figure 4. Herb and litter mean carbon stock distribution in Yegof mountain (HC = herbaceous plant carbon, LC = little carbon, LGH = little and herb carbon and CO2 = carbon dioxide equivalent GHL) (ton ha−1)
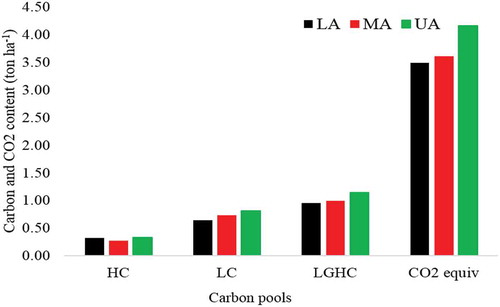
Table 2. Means (±SD) of soil bulk density, %carbon and SOC across altitudinal gradients
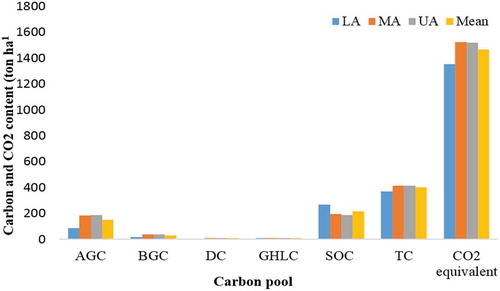
Figure 5. Total carbon stock distribution in Yegof mountain