
Figures & data
Figure 1. Agricultural value chain Map, Source: Lundy et al. (Citation2012): Link Model
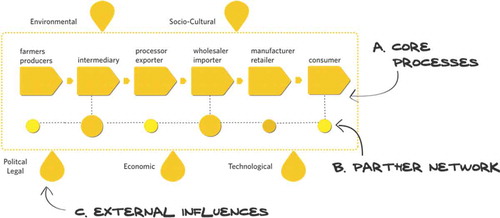
Table 1. Selected indicators for the sustainability of banana value chain in Arba Minch district of Ethiopia
Figure 2. Location map of the Arba Minch Zuriya district, Ethiopia
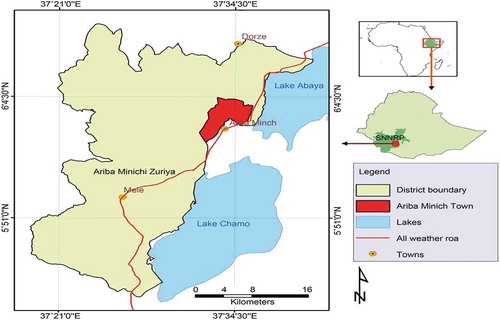
Table 2. Summary of research questions and data collection methods
Table 3. Demographic and socio-economic characteristics of sampled banana farmers
Figure 3. Banana value chain map in Arba Minch district, Ethiopia
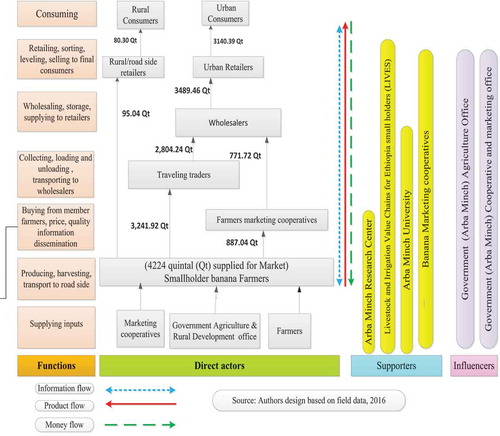
Figure 4. Banana plantations and harvested banana fruit waiting for collectors at road side in Arba Minch
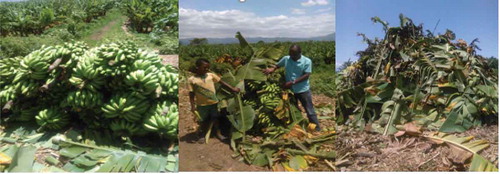
Figure 5. Banana leaves and sucker management in Arba Minch
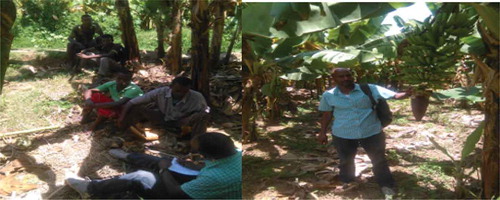
Figure 6. Figure bananas weighing and loading by traveling traders in Arba Minch
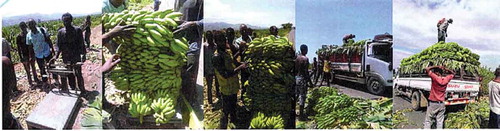
Figure 7. Banana retail market in Hawassa, Ethiopia
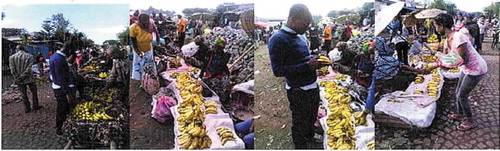
Table 4. Production cost, cost price and volume of banana produced per hectare
Table 5. Profit margin and value shares of producer and traders in Arba Minch
Table 6. Distribution of added value share of the actors in the marketing channels
Table 7. Suitability assessment of banana value chain in Arba Minch
Table 8. Sustainability performance of banana value chain in Arba Minch
Table 9. PESTEC Analysis of banana value chain in Arba Minch
