
Figures & data
Figure 1. The conceptual framework
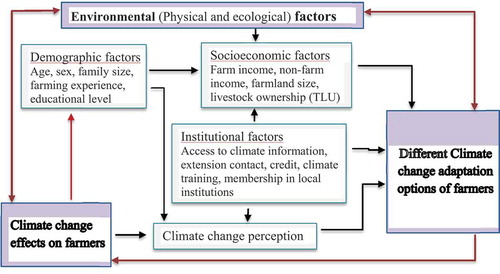
Figure 2. The study area
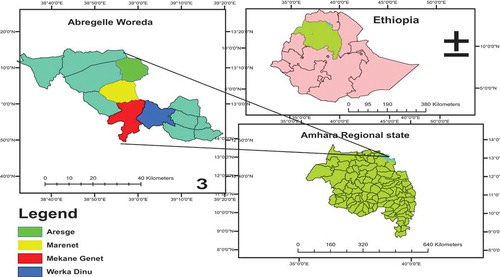
Table 1. Farmers’ climate change perception levels disaggregated by age, education and sex (n = 260)
Figure 3. Mean annual temperature trends of the district (1997–2016)
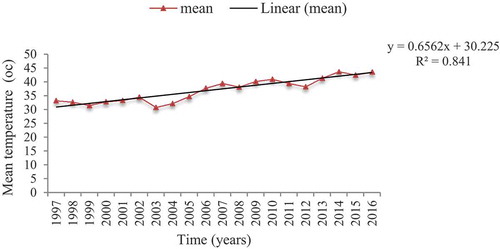
Figure 4. Mean annual rainfall trends of the district (1997–2016)
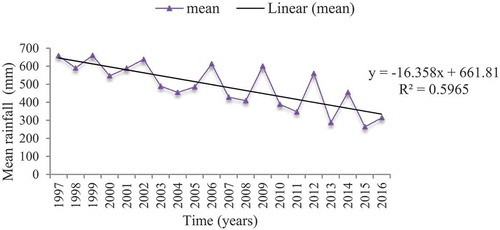
Table 2. Perception on climate change causes, indicators and effects (combined responses of 5-point Likert item statement), n = 260
Table 3. Classification of farmers’ response mechanisms to climate change, multiple responses
Table 4. Estimation of independent variables in probit model, n = 260
Table A5. Likert statements’ reliability test statistics
Figure 5. Barriers to climate change adaptation
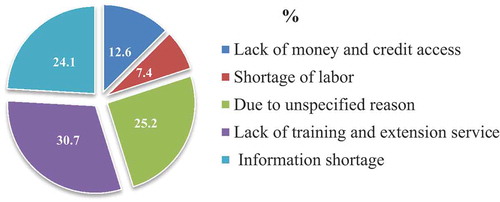
Table A1. Sample households’ socioeconomic characteristics, n = 260
Table A2. Sample households’ institutional features, n = 260
Table A3. Multicollinearity test of continuous explanatory variables
Table A4. Multicollinearity test of dummy explanatory variables
Table A6. Climate data of Abergelle district (1997–2016)