Figures & data
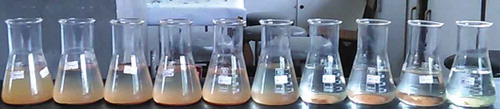
Figure 1. Wastewater before and after treatment with different adsorbent dose (i.e. 20, 30, 40, 50, 60, 70, 80, 90, 100, and 110 mg L−1 adsorbent dose from left to right respectively).

Figure 2. SEM surface image of the Moringa stenopetala seed powder.
Figure 3. XRD pattern of Moringa stenopetala seed powder.
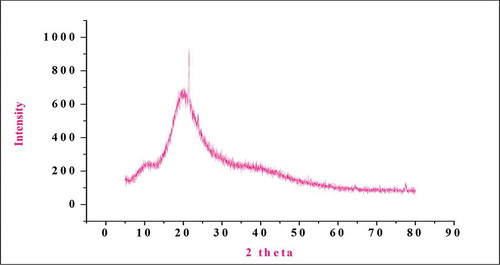
Table 1. Freundlich and Langmuir adsorption isotherm constants
Table 2. Removal efficiency of physical parameters from coffee processing wastewater through adsorption by M. stenopetala seed powder along with world health organization (WHO) permissible limits discharged to water system
Table 3. Removal efficiency of chemical parameters of coffee processing wastewater through adsorption by M. stenopetala seed powder along with WHO permissible limits discharged to the water system
Table 4. Removal efficiency of bacterial load of coffee processing wastewater through adsorption by M. stenopetala seed powder along with WHO permissible limits discharged to the water system
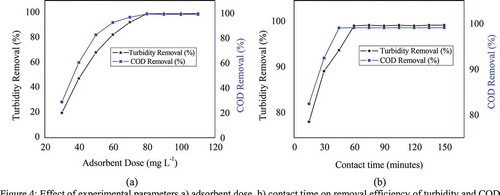
Figure 4. Effect of experimental parameters (a) adsorbent dose and (b) contact time on removal efficiency of turbidity and COD.