Figures & data
Figure 1. Location map of the study sites in Gusha Shinkurta rural village, Guagusa Shikudad district, Amhara region, northwest Ethiopian highlands (Democh was station testing site, while Buahit, Cherta, Enter and Zoble were on-farm testing sites).
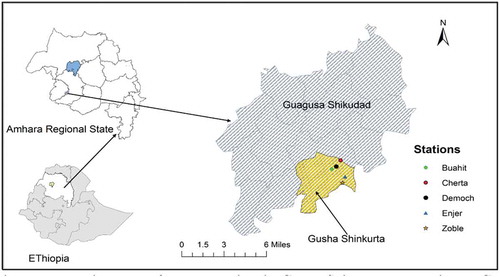
Table 1. Three phases of crop rotations used for the experiment in three consecutive years from 2013 to 2015
Table 2. Physicochemical properties of the experimental soils before starting the experiment in 2013 in Awi highlands, northwest Ethiopia
Table 3. Average soil properties over sites combination after three-year interventions of crop rotation and manure application in 2015 in Awi highlands, northwest Ethiopia
Table 4. Average percentile changes of soil properties over sites combination after three-year interventions of crop rotation and manure application in 2015 compared to the initial before starting the experiments in 2013 in Awi highlands, northwest Ethiopia
Figure 2. Average grain productivity of bread wheat over sites combination as influenced by interaction of crop rotation and manure application in three rotation phases (2013–2015) in northwest Ethiopian highlands (bars followed with the same letters are not significantly different at P ≥ 0.05).
Figure 3. Average grain productivity of bread wheat over sites combination as influenced by crop rotation in three consecutive rotation phases (2013–2015) in northwest Ethiopian highlands (bars followed with the same letters are not significantly different at P ≥ 0.05).
Figure 4. Average grain productivity of bread wheat over sites combination as influenced by manure application in three consecutive rotation phases (2013–2015) in northwest Ethiopian highlands (bars followed with the same letters are not significantly different at P ≥ 0.05).
Figure 5. Average tuber productivity of potato over sites combination as influenced by interaction of crop rotation and manure application for three rotation phases (2013–2015) in northwest Ethiopian highlands (bars followed with the same letters are not significantly different at P ≥ 0.05).
Figure 6. Average tuber productivity of potato over sites combination as influenced by crop rotation in three consecutive rotation phases (2013–2015) in northwest Ethiopian highlands (bars followed with the same letters are not significantly different at P ≥ 0.05).
Figure 7. Average tuber productivity of potato over sites combination as influenced by manure application in three consecutive rotation phases (2013–2015) in northwest Ethiopian highlands (bars followed with the same letters are not significantly different at P ≥ 0.05).