
Figures & data
Figure 1. Map of the study area
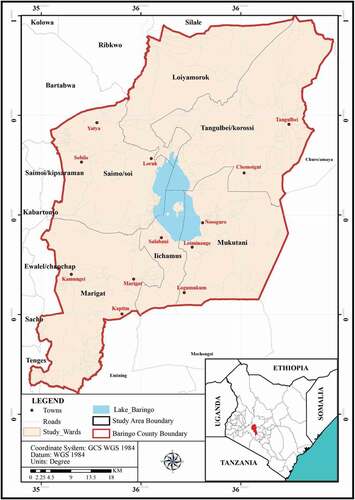
Figure 2. (a) community assessment of change in average household crop land size in acres (b) GIS analysis of change in crop production area from 1980 to 2019 (Source: Study Data)
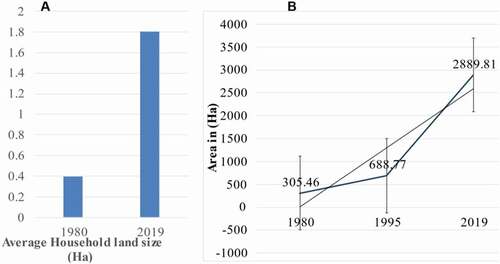
Figure 3. (a) Reasons for increase in enclosures. (b) Reasons for decline in nomadism/livestock mobility
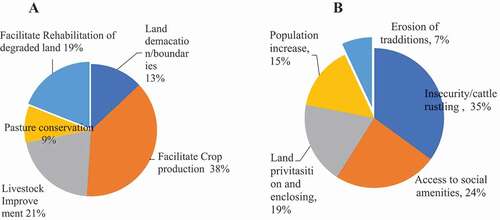
Figure 4. Change in livestock population from1975 to 2018
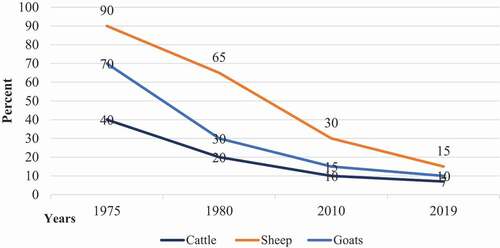
Table 1. Reasons for change in livestock population
Figure 5. (a) Percent respondents who reported land cover change; (b) GIS analysis on change in area covered by shrubs from1980 to 2019
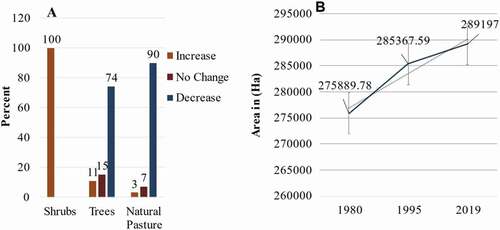
Figure 6. Land use and land cover in the year 1980
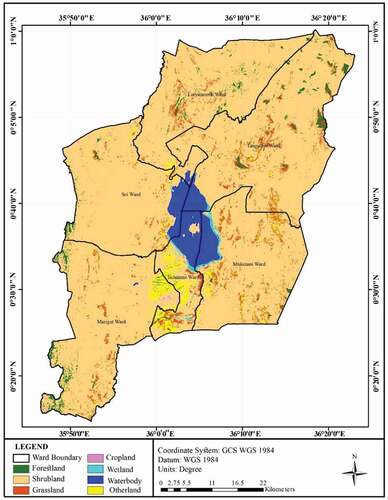
Figure 7. Land use and land cover in the year 1995
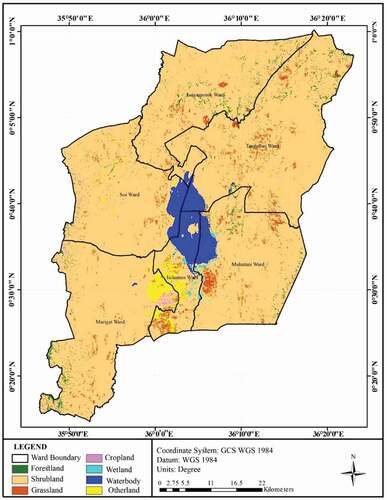
Figure 8. Land use and land cover in the year 2019
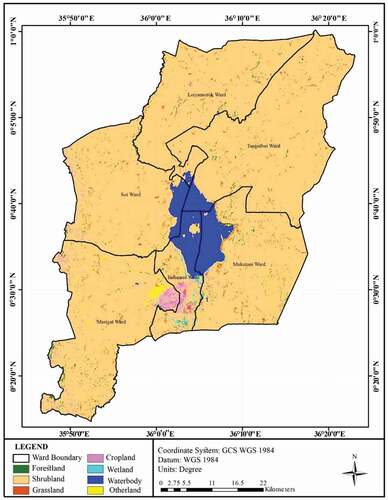
Table 2. Summary of land use and cover types in the study area between years 1980 to 2019