Figures & data
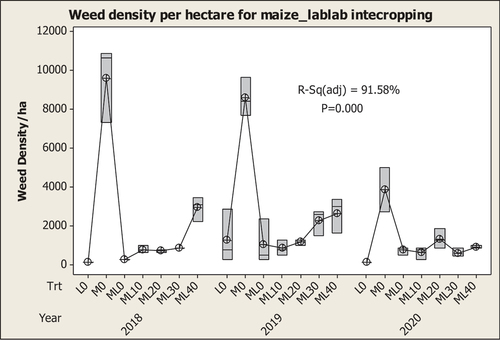
Figure 1. Map of study area and climatic data.
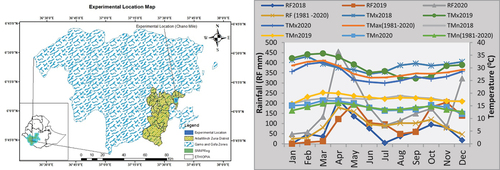
Figure 2. Mean values of lablab dry matter yield under maize lablab intercropping in 2018, 2019 and 2020 cropping seasons.
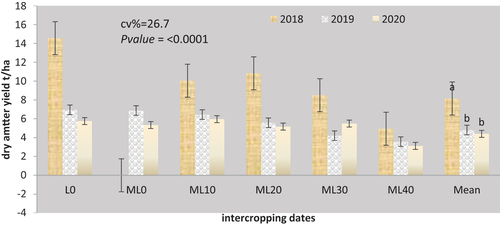
Figure 3.: weed density of parthenium for maize lablab intercropping and association with biological yields.
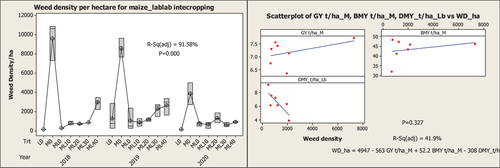
Table 1. Laboratory analysis of a composite (0‒30 cm) soil sample collected from the experimental site (Chano Mille)
Table 2. Mean values of lablab growth parameters and Leaf to stem ratio (LSR) in 2018, 2019, and 2020 cropping seasons under maize lablab intercropping system
Table 3. Mean values of growth parameters and yield components of maize in 2018, 2019, 2020 cropping seasons under maize lablab intercropping system
Table 4. Mean values of grain yield (GY t/ha), biomass yield (BMY t/ha) and harvest index (HI) of maize in 2018, 2019, 2020 cropping seasons under maize lablab intercropping system
Table 5. Monetary value index (MVI), land equivalent ratio (LER) and relative yield (RY) value of maize lablab intercropping in 2018, 2019 and 2020 cropping seasons under maize lablab intercropping system