
Figures & data
Table 1. List of the 40 landraces of rice
Table 2. Analysis of variance (ANOVA) for different phenotypic attributes of 40 landraces of rice
Table 3. Phenotypic performance of the studied landraces for different agro-morphological attributes
Figure 1. Clustering of 40 landraces from haor areas in Bangladesh based on phenotypic attributes.
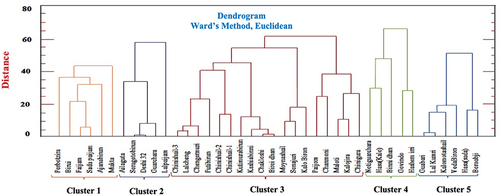
Table 4. Intra-inter cluster distance (D = ) in 40 rice genotypes
Table 5. Cluster mean for yield and yield contributing characters of 40 rice landraces
Figure 2. Loading plot of principal component analysis (PCA) showing diversity of yield and yield attributes of 40 landraces from haor areas in Bangladesh.
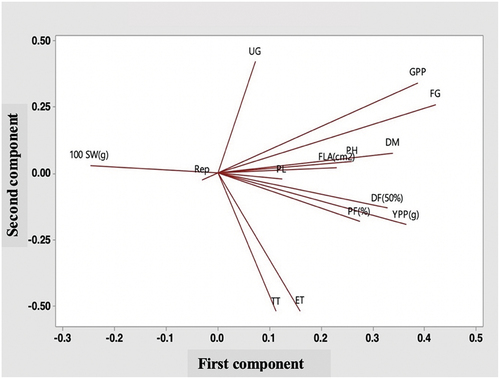
Table 6. Principal components (PCs) for morphological traits of 40 rice genotypes
Figure 3. Banding pattern of 40 landraces from haor areas in Bangladesh for SSR marker RM 25.
Table 7. SSR markers analysis of 40 rice genotypes for 6 microsatellites (SSR) markers
Figure 4. UPGMA (Unweighted Pair Group Method of Arithmetic means) Phylograph showing clustering of 40 landraces from haor areas in Bangladesh based on 6 SSR marker analysis.
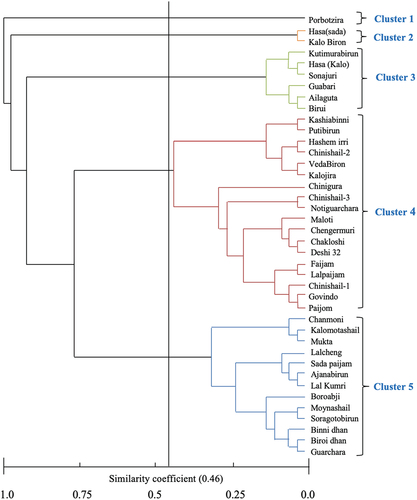
Figure 5. Pie chart showing categorization of 40 landraces from haor areas in Bangladesh for grain quality traits.
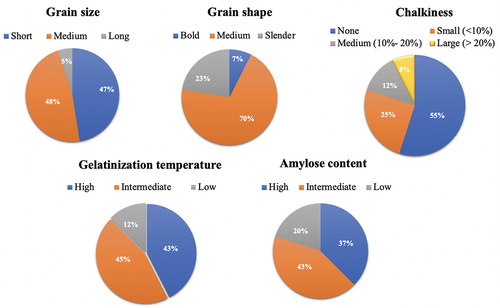
Table 8. Performance of the 40 rice landraces considering grain quality traits
Table 9. Correlation among the studied grain quality traits