
Figures & data
Table 1. Percentage distribution the demographic and socioeconomic characteristics of the respondents
Figure 1. Percentage distribution of the livestock farmers’ responses on whether they had received training in the past 6 months (n = 50).
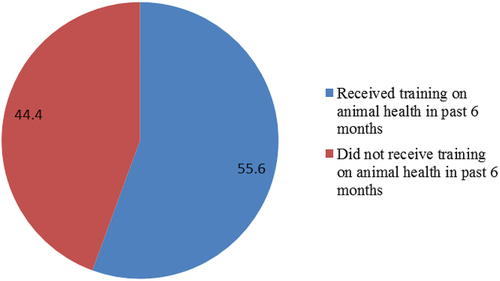
Figure 2. Percentage distribution of the tentative diagnosis of the cattle disease (DVS quarterly report, March 2021) (number of cases = 53).
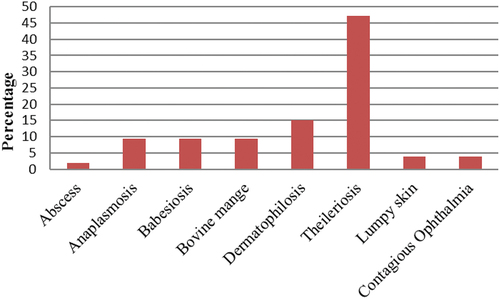
Figure 3. Percentage distribution of the farmers’ responses on cause of cattle deaths (n = 50).
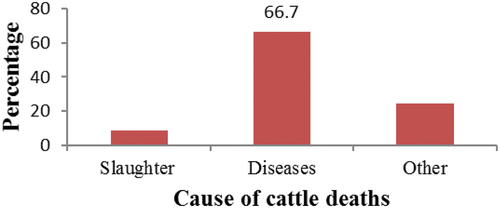
Table 2. Percentage distribution of the dipping situation
Figure 4. Percentage distribution of the respondents’ main challenges on dipping of cattle (n = 50).
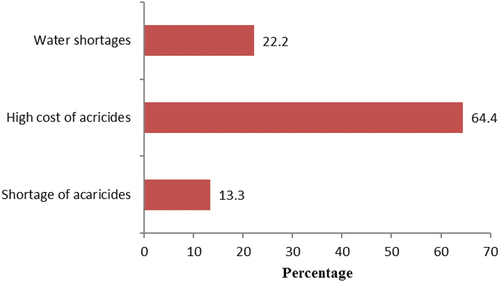
Table 3. Suggestions by farmers to improve dipping situation