
Figures & data
Table 1. Descriptive statistics of cereal production
Table 2. Preliminary analysis of climate variable
Table 3. Trend analysis of cereal production
Figure 1. Trend of millet output from 1970 to 2018.
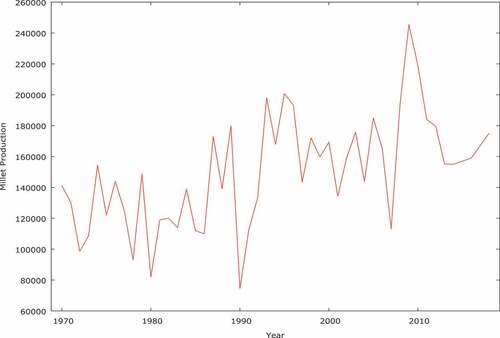
Figure 2. Trend of sorghum from 1970 to 2018.
The estimated parameters of the best fit trend of the cereals are presented in .
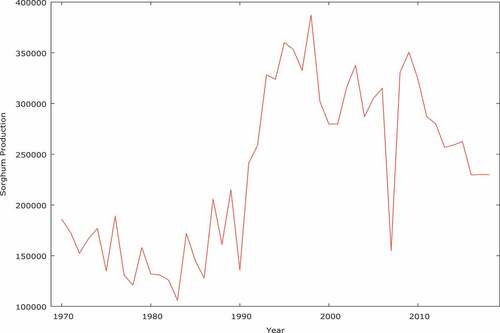
Table 4. Estimated parameters for the best-fit trend of cereal production
Table 5. Trend analysis of climate variables
Figure 3. Trend of CO2 emission from 1970 to 2018.
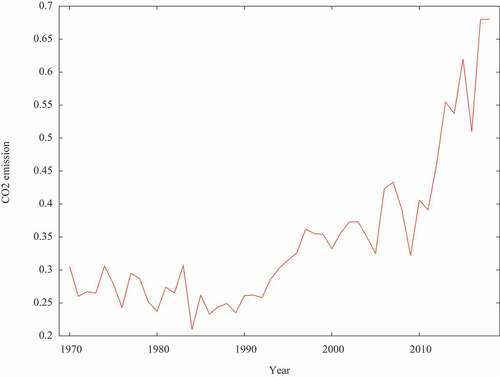
Figure 4. Trend of rainfall from 1970 to 2018.
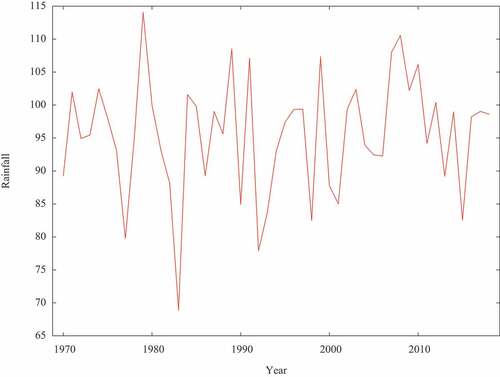
Figure 5. Trend of temperature from 1970 to 2018.
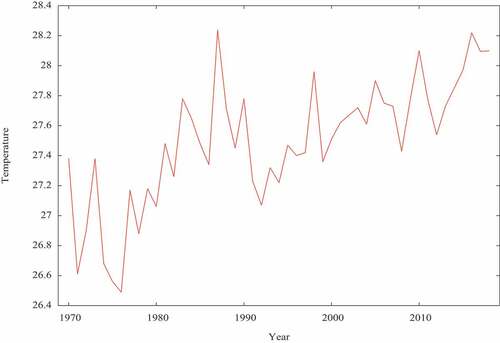
Table 6. Estimated parameters for the best trend of climate variables
Table 7. KPSS test of the series in levels
Table 8. KPSS test of the first difference of the series
Table 9. ARDL cointegration test between cereals production and climate variables
Table 10. Ljung-box test and ARCH-LM test for models millet and sorghum production and climate variables