Figures & data
Figure 1. Location map of the study area. Source: Ethio GIS (2021).
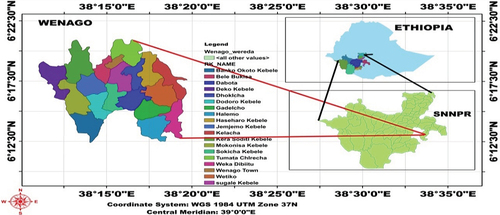
Table 1. List of trees, shrubs and herb recorded in exclosure and adjacent open grazing land of Wenago district
Table 2. Identified growth forms in exclosure and adjacent open grazing lands and an area they covered
Figure 2. Population frequency value of trees (left) and shrubs (right) in the sampled exclosure area of Wenago district.
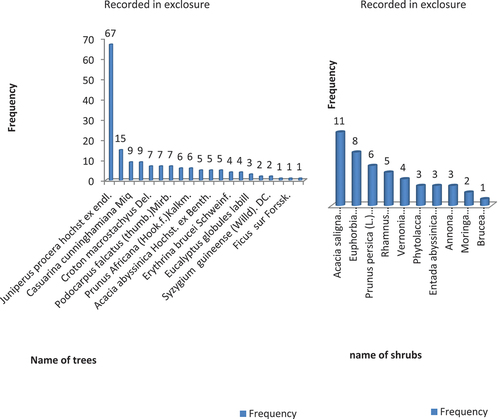
Figure 3. Population frequency value of trees (left) and shrubs (right) in the sampled open grazing land of Wenago district Source: woody species inventory and measurement result (2021).
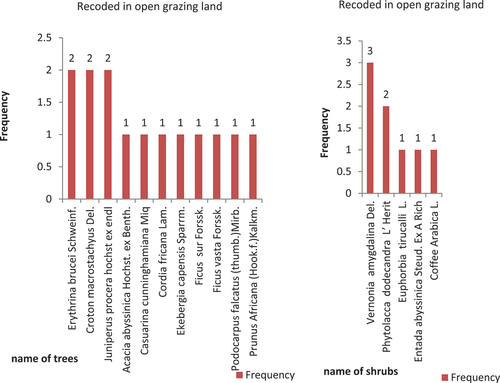
Figure 4. Percentage of plant growth forms (left) and origin of woody species (right) identified and recorded in the study area). Source: woody species inventory and measurement result (2021).
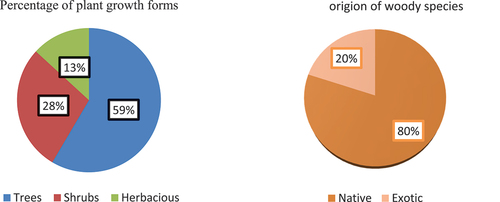
Table 3. Frequency and diversity (H') of woody species in exclosure of the study area (Wenago district)
Table 4. Comparison of species diversity indices (H’) and evenness species (E) between exclosure and adjacent open grazing land
Figure 5. The overview of physical difference between treated exclosure (Figure 5A) & the untreated adjacent open grazing land (Figure 5B) in the study area: Source: field observation and Photographs by the researcher (October, 2021).
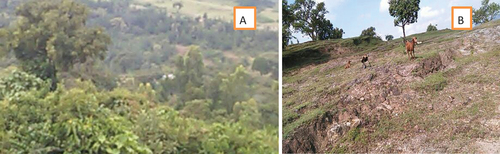
Figure 6.. The linear relationship of woody species diversity with exclosure (a) and adjacent open grazing land (b).
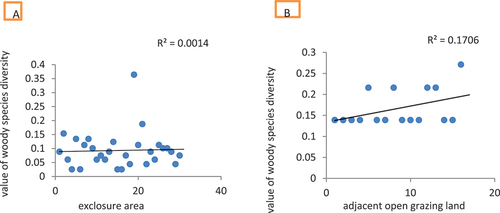
Table 5. Species composition similarity between exclosure and open grazing land using Sorenson’s species similarity index (%)
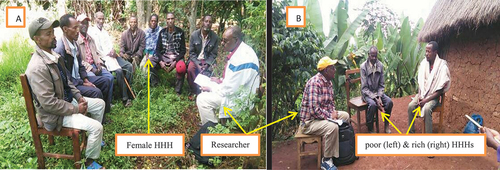
Figure 7. Focus group discussion under tree shadow (Picture 7A) and key informant interview in interviewee’s private house compound (Picture 7B). Source: interview and group discussion result. Photograph by the researcher (April, 2021).