Figures & data
Table 1. Cowpea varieties released in Zambia
Table 2. Characteristic traits of the seven released varieties in Zambia
Figure 1. Regional production of cowpea in Zambia.
Source: Supplemental survey FSRP, 2008
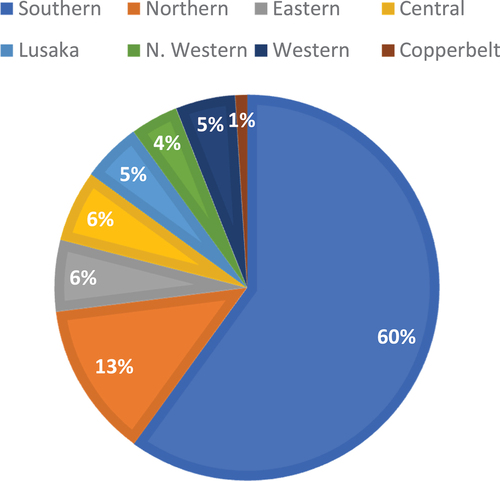
Figure 2. Area cultivated (1,000 hectares) and production of major crops (1,000 metric tonnes), 2017/2018 and 2018/2019.
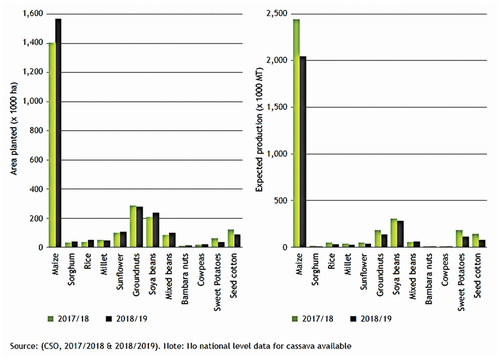
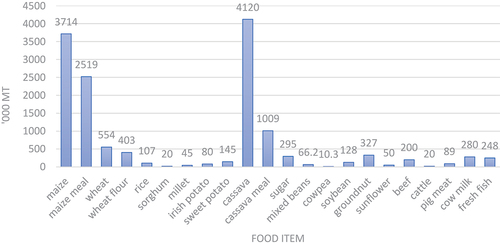
Table 3. Nutrition food balance sheet food items in Zambia
Table 4. Farmer identified constraints in cowpea production
Figure 4. Cowpea sold as grain and as a snack in Zambia (Photo Credit: COMACO,2022).
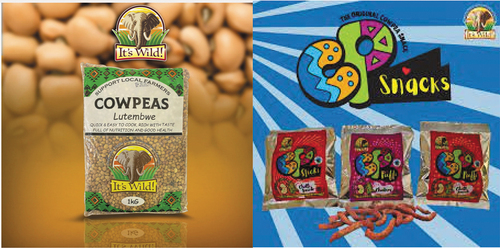
Figure 5. Dried cowpea leaves commonly known as “kachesha” sold on the Zambian market.
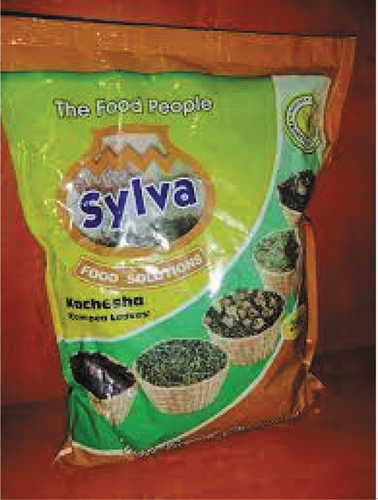
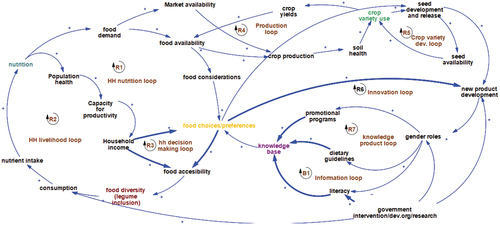
Figure 6. Beginning with the end-user in mind:cowpea systems analyses.