
Figures & data
Figure 1. Map of the study area.
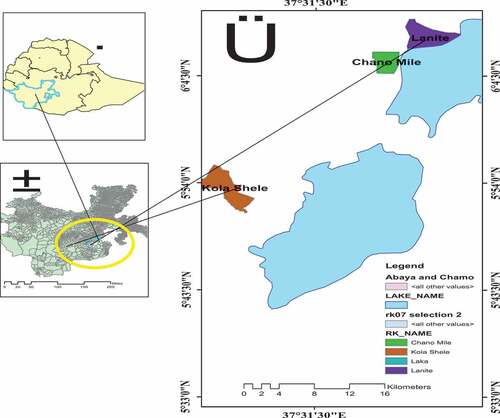
Table 1. Respondents’ demographic characteristics and their statistical tests
Table 2. Environmental parameters and their significance level at P < 0.05
Figure 2. The socio-economic role of agroforestry in the study area.
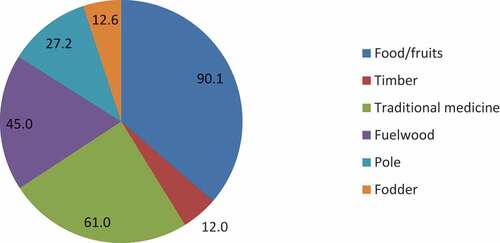
Table 3. Socio-economic role of MBAF and NMBAF with statistical difference (P < 0.05)